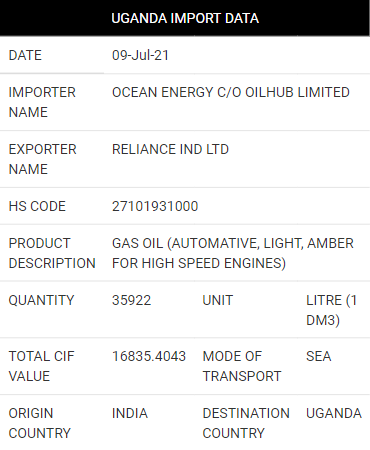
Uganda Import Data
Another name for Uganda is the Republic of Uganda. You may find Uganda in East Africa. The nation borders several other nations, including Kenya, South Sudan, the Democratic Republic of Congo, Rwanda, and Tanzania. The country is growing in the direction of Lake Victoria and the south. In the sub-Saharan country of Uganda, agriculture is the main driver of the economy. According to ECI, Uganda ranks 104th out of all the nations with the most complex economies. In terms of overall imports across all nations, Uganda ranked 104th out of 226 countries, according to import data. Uganda, located in East Africa, offers a strategic gateway to various landlocked countries within the region. With a relatively stable economy and a focus on developing sectors like agriculture, manufacturing, and services, Uganda presents lucrative opportunities for international trade.
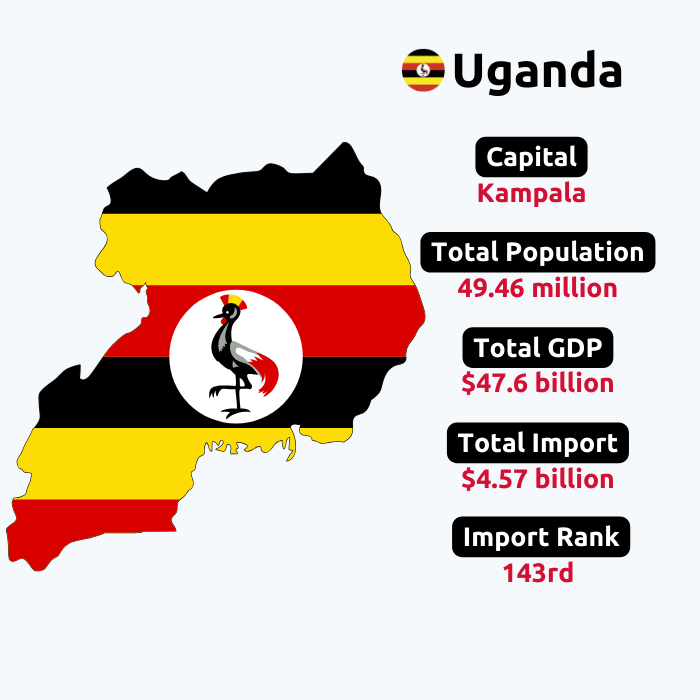
According to Uganda's import data, Uganda's imports of goods reached a total value of $12.2 billion in 2025. Uganda's total imports of commodities grew by 21% in 2025 compared to the previous year as per the import data of Uganda. Mineral fuels and oils are the biggest imports of Uganda as per the data on Uganda imports, while China is its biggest import partner, as per Uganda trade data. The total GDP of Uganda is $47.6 billion, and its GDP import share is 29.5%. Uganda is a part of trading blocs such as EAC and COMESA. Let us explore Uganda customs import data for the year 2025 and gain insights into the country's major import trends and shipment data.