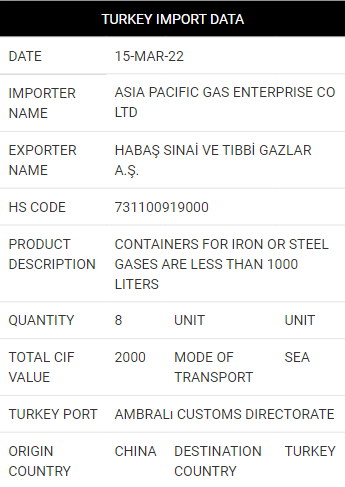
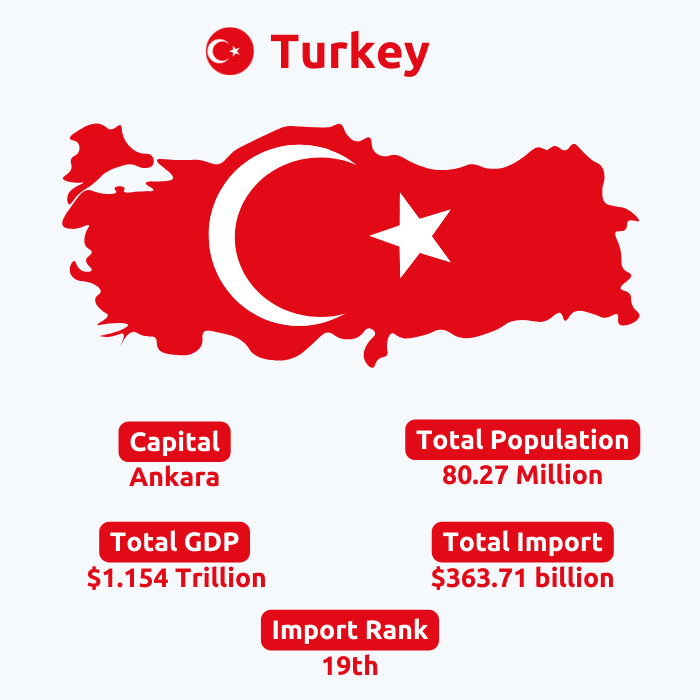
Turkey is also popularly known as the Republic of Turkey. Turkey is a trans-continental state and due to this factor, it has its territory in 2 continents namely, western Asia and Southeast Europe. The nation shares its boundaries with numerous recognized countries like Georgia, Armenia, Iraq, Syria, and Greece. As per the data, the economy of Turkey is listed in the top 38 countries of the world in terms of complexity. As per Turkey import data, the country stood at 23rd position out of 226 countries in total imports in the year 2020. In 2020, Turkey was the biggest importer of waste iron, filament yarn, seeds of sunflowers, and artificial staple fibers.
Turkey import data insights tells those imports to Turkey amounted to approximately USD 363.71 billion for goods in 2022. Apart from this, Turkey imported services worth USD 31.60 billion in the year 2021. Significant imports of Turkey as recorded in Turkey trade data 2021 were mineral fuels and oils, machines, iron and steel, plastic products, and automobiles.
Turkish population as of the year 2020 was nearly 8.36 crores. Major trading countries of Turkey as unveiled by Turkey trade data 2021 were Russia, China, Germany, Switzerland, the USA, and Italy.
All the trade statistics like Turkey Import Data reports that are delivered by us to you are extremely valuable and useful. Our information is completely founded on refreshed and crisp delivery bills, solicitations, and other significant documentation required for foreign trade. We gather the most accurate data from Turkey's traditions ports, establishments, and other delivery organizations. Various fields that are included in the trade reports provided by TradeImeX with respect to Turkey Trade Data are HS codes, about the product, amount and value, ports' names alongside cash currency.
TURKEY IMPORT DATA | |||
DATE | 15-MAR-22 | ||
---|---|---|---|
IMPORTER NAME | ASIA PACIFIC GAS ENTERPRISE CO LTD | ||
EXPORTER NAME | HABAŞ SINAİ VE TIBBİ GAZLAR A.Ş. | ||
HS CODE | 731100919000 | ||
PRODUCT DESCRIPTION | CONTAINERS FOR IRON OR STEEL GASES ARE LESS THAN 1000 LITERS | ||
QUANTITY | 8 | UNIT | UNIT |
TOTAL CIF VALUE | 2000 | MODE OF TRANSPORT | SEA |
TURKEY PORT | AMBRALı CUSTOMS DIRECTORATE | ||
ORIGIN COUNTRY | CHINA | DESTINATION COUNTRY | TURKEY |
For your better understanding and learnings, we have encased an example including custom Turkey import Data so you can see how an actual database with complete information seem to be.
In the year 2021, Turkey imported numerous items from various countries. As every country maintains its import export data to record all the overseas transactions, in the similar manner, Turkey also maintains its Turkey Import Data in which it records the major imports that happened into the nation in a particular year. So, as per Turkey Import Data for the year 2021, the top 10 imports to the nation were as follows.
Mineral fuels and oils (USD 50.69 billion), machinery and appliances (USD 30.96 billion), iron and steel (USD 27.61 billion), electrical machines (USD 19.96 billion), plastic items (USD 17.59 billion), light automobile (USD 15.59 billion), organic chemicals (USD 9.34 billion), natural and precious pearls (USD 7.07 billion), pharmaceutical products (USD 6.87 billion), and finally aluminum goods (USD 6.59 billion).
From the top 10 imported products list, the contribution of mineral oils and fuels is the most which is 18.6%, this is then followed by the contribution of machines and appliances which is approximately 11.40%.
According to Turkey Import Data for the year 2021, the top 10 countries from whom Turkey imported the most were as follows:
China (USD 32.23 billion), Russia (USD 28.95 billion), Area Nes (USD 24.39 billion), Germany (USD 21.75 billion), the USA (USD 13.14 billion), Italy (USD 11.56 billion), India (USD 7.93 billion), France (USD 7.93 billion), Korea (USD 7.59 billion), and Spain (USD 6.31 billion).
After carefully analyzing the contribution of each country in the year 2021, we reached to a conclusion that around 11.87% of total imports made by Turkey were from China, and then trailed by Russia with 10.66% contribution in total imports.