Central-Africa import Statistics

Central Africa Import Data

Central Africa is a region characterized by its rich natural resources, diverse cultures, and evolving economies. Encompassing countries such as Cameroon, the Central African Republic, Chad, Congo, Gabon, and Equatorial Guinea, the region plays a significant role in global trade, particularly through its import activities. The import sector in Central Africa is pivotal to its economic development and regional integration.

According to the Central Africa import data, in 2023, the total value of imports for Central Africa reached approximately $501.6 million. The region's total GDP is at $6 billion, with the total GDP import share standing at around 8%. The leading import commodities for Central Africa include vehicles, mineral fuels and oils, machinery, and pharmaceuticals. China remains a dominant import partner in the region, along with other key trading nations. Let's delve into the Central Africa import data for 2023, highlighting key trends, top imports, and their impact on the region's economy.

 Central Africa Import Data | Central Africa Customs Data | Central Africa Trade Data

189

The region is positioned 189th globally in terms of import value, reflecting its growing presence in international trade.

0.06%

With a 0.06% share in global imports, Central Africa is gradually enhancing its role in the international import market.

CHINA

China is the leading import partner for Central Africa, contributing significantly to the region's import statistics.

VEHICLES

Vehicles constitute the largest share of imports, underscoring their importance to the region's economic infrastructure.

import

Top 10 Imports of Central Africa

Central Africa’s import market is diverse, with several key sectors contributing to its economic development. The top 10 imports in 2023, according to the import data, are:

  • Vehicles (HS code 87): 28% ($148.63 million)
  • Mineral Fuels and oils (HS code 27): 22% ($100.17 million)
  • Nuclear reactors and machinery (HS code 84): 18% ($67.43 million)
  • Electrical machinery and equipment (HS code 85): 12% ($58.42 million)
  • Pharmaceutical Products (HS code 30): 7% ($48.19 million)
  • Articles of iron and steel (HS code 73): 5% ($28 million)
  • Miscellaneous edible preparations (HS code 21): 4% ($20.10 million)
  • Meat and edible meat offal (HS code 02): 3% ($19.99 million)
  • Plastics and articles thereof (HS code 39): 2% ($17.53 million)
  • Cereals (HS code 10): 1% ($16.55 million)
  • Partners

    Top 10 Import Partners of Central Africa

    The region has established robust trade relationships with several nations. The top 10 import partners for Central Africa in 2023 are:

    Value In Percentage(%)

  • China: 26% ($126.01 million)
  • Cameroon: 14% ($15.02 million)
  • France: 11% ($83.07 million)
  • Ivory Coast: 9% ($47.82 million)
  • Japan: 8% ($37.57 million)
  • India: 7% ($32 million)
  • USA: 6% ($29.80 million)
  • UAE: 5% ($24.59 million)
  • Dr Congo: 4% ($20.66 million)
  • Belgium: 3% ($18.35 million)
  • Sample Data

    Central Africa’s Import Data

    We obtain trustworthy data from organizations, shipping businesses, and customs ports. This Trade Data contains a wide range of fields, such as HS codes, product descriptions, prices, quantities, origin country, destination country, and port names together with currency values. For traders and marketers, this trade data is crucial information that helps them to make informed decisions. From the HS codes and product descriptions to the quantity and cost of each product, everything can be obtained through this trade data. We have included a sample of this trade data for your convenience and greater understanding so that you can see what the trade data looks like as a whole, with complete details.

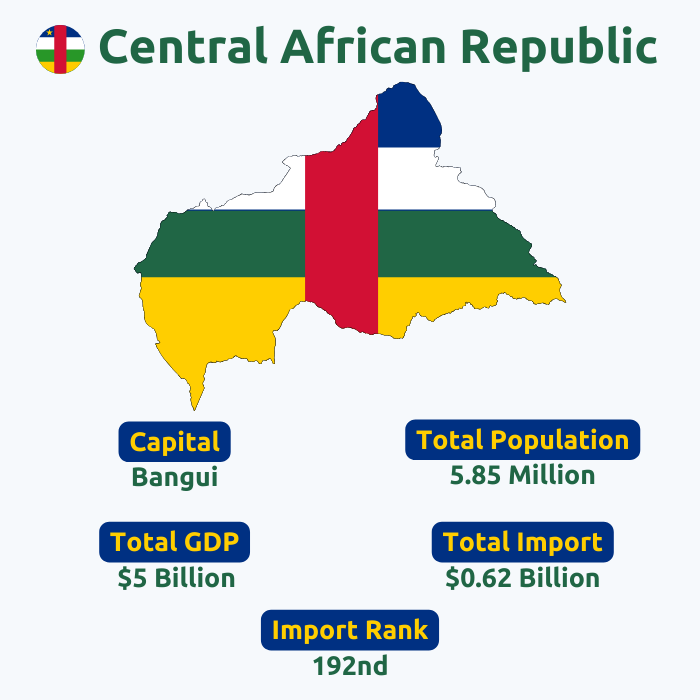
    As an evolving economic region, Central Africa relies heavily on imports to meet domestic needs and drive economic growth. The import market presents various opportunities for international traders and businesses. Key statistics from the Central Africa import data for 2023 highlight significant trends and patterns, providing valuable insights for market analysis and decision-making. The data, sourced from customs authorities and other relevant organizations, includes comprehensive details such as date, importer and exporter names, product descriptions, HS codes, quantities, and values. So, as you can see, we obtain trustworthy data from organizations, shipping businesses, and customs ports. The trade data contains a wide range of fields, such as HS codes, product descriptions, prices, quantities, origin country, importers/exporters names and addresses, destination country, and port names together with currency values. For traders and marketers, this trade data is crucial information that helps them make informed decisions. From the HS codes and product descriptions to the quantity and cost of each product, everything can be obtained through this trade data. We have included a sample of the trade data for your convenience and greater understanding so that you can see what the trade data looks like as a whole, with complete details.

    Benefits

    Benefits of Central Africa’s Import Data

  • Expand Your Business into the Central African Market
  • View Recent Product Demand and Price Trends
  • Track and Analyze Competitor Shipment Histories
  • Develop Data-Driven Marketing Strategies
  • Establish a Strong Market Presence in Central Africa
  • Enhance ROI and Achieve Long-Term Business Goals
  • Frequently Asked Questions!!

    Central Africa imported goods worth $12 billion in 2023.

    The top imports include mineral fuels and oils, machinery, and electrical equipment.

    Major import partners are China, France, Nigeria, Belgium, and the United States.

    Yes, there has been a noticeable shift towards increasing imports of machinery and pharmaceuticals.

    The import data reflects the region's demand for foreign goods and influences its trade balance and overall economic development.

    You might be interested in other continents as well