Exploring Granite Imports Data 2025: Global Marble & Granite Importers Database
Discover the latest marble import and granite import data, top granite importing countries, leading granite importers, and the largest importer of granite worldwide.
The global marble and granite trade sits at the intersection of construction, design, infrastructure, and international trade. In 2025, this industry is more data-driven than ever. Buyers are no longer relying on guesswork or fragmented supplier lists. Instead, they are using detailed import databases to identify opportunities, benchmark prices, and build reliable supply chains. According to the latest Granite import data and global trade data, the total value of global granite imports reached $10.36 billion in 2025, a 1% increase from the previous year. The US is the largest importer of granite, as per the US import data & granite import data by HS code 6802.
Most articles about the granite trade throw numbers at you and call it insight. But if you're actually in this business, sourcing, exporting, or trying to enter new markets, raw numbers don’t help much. What matters is knowing who is buying granite, how often, at what price, and where the gaps are. That’s where granite import data becomes useful. Not as a statistic, but as a working tool. This blog breaks down the granite imports landscape in 2025, with a strong focus on global importer databases, market trends, and actionable insights for businesses.
The Global Granite Trade Landscape in 2025
Granite continues to be one of the most widely traded natural stones in the world. Its durability, resistance to weather, and premium appearance make it a preferred material in construction, interior design, and infrastructure.
In 2025, the global granite trade reflects a few clear realities:
-
Demand is steady and tied closely to construction activity.
-
Trade flows are highly international and interconnected.
-
A relatively small number of countries dominate the supply, while demand is more distributed.
Granite moves across continents in both raw and finished forms. Raw blocks are typically shipped to processing hubs, where they are cut, polished, and transformed into slabs, tiles, or customized products. These finished goods are then exported again to end markets. This two-stage trade structure is one of the key reasons why import data is so valuable. It reveals not just who is buying, but how the global value chain is organized.
Global Granite Market Size and Growth
Let’s start with the big picture.
-
The global natural stone market is valued at approximately $43–45 billion in 2025
-
Granite accounts for a significant share, with the granite market estimated at $20–21 billion
-
The industry is growing at a steady 3.5%–4% CAGR
What’s driving this growth?
-
Rapid urbanization in Asia and Africa
-
Strong renovation demand in North America and Europe
-
Increased use of natural stone in luxury and commercial projects
-
Expansion of infrastructure projects globally
Granite remains one of the most traded stones because it balances durability, cost, and aesthetics. The global demand for natural stones continues to grow, with granite and marble import trends showing strong activity across key markets. Top marble-importing countries are expanding construction and infrastructure projects, while the largest importer of granite leads the surge in granite imports worldwide. Businesses are actively searching for reliable granite importers and identifying top granite importing countries to expand their reach.
Granite Imports by Country: Top 10 Granite Importing Countries
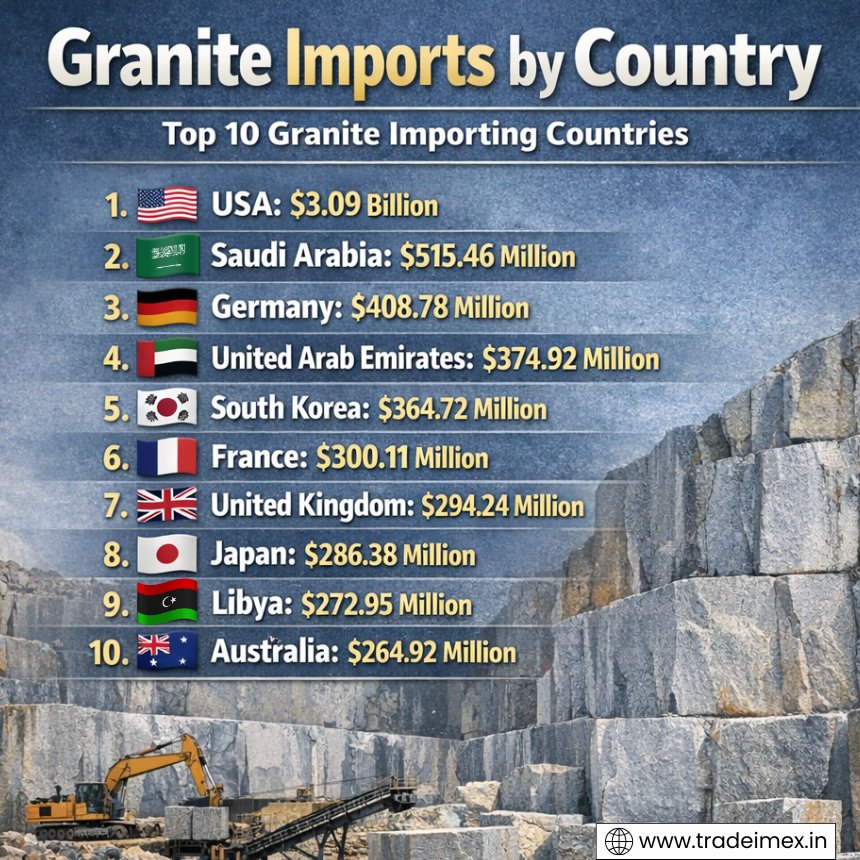
Granite imports by country are a significant aspect of the global stone market, with specific countries standing out as major players in this sector. The global demand for granite continues to rise, with countries around the world importing this versatile and durable stone for various construction and decoration purposes.
The top 10 granite-importing countries showcase a robust demand for this natural stone, reflecting various factors such as construction projects, infrastructure development, and interior design trends. These countries play a pivotal role in shaping the granite importing landscape, highlighting the importance of trade relationships and supply chains in the industry. The leading granite importers by country, as per the granite shipment data and global import data for 2025, include:
1. USA: $3.09 Billion (29.9%)
The United States tops the list as the largest importer of granite in 2025, with an import value of $3.09 billion, accounting for 29.9% of the total global imports, as per the US granite import data. The demand for granite in the USA is driven by its use in residential and commercial construction projects, as well as in the manufacturing of kitchen countertops and vanities.
2. Saudi Arabia: $515.46 Million (5%)
Saudi Arabia ranks second on the list of top granite importers, with an import value of $515.46 million, representing 5% of the global imports. The country's booming construction industry and infrastructural development projects drive the demand for granite as a key building material.
3. Germany: $408.78 Million (4.5%)
Germany holds the third position among the top granite-importing countries in 2025, with an import value of $408.78 million, accounting for 4.5% of the total global imports. The use of granite in architectural and interior design applications continues to fuel the demand in the German market.
4. United Arab Emirates: $374.92 Million (3.6%)
The United Arab Emirates ranks fourth on the list, with an import value of $374.92 million, representing 3.6% of the global imports. The country's thriving real estate sector and urban development projects drive the demand for granite as a premium building material.
5. South Korea: $364.72 Million (3.1%)
South Korea secures the fifth position among the top granite-importing countries, with an import value of $364.72 million, accounting for 3.1% of the global imports. The use of granite in infrastructure projects, urban landscaping, and interior design applications contributes to the high demand in the Korean market.
6. France: $300.11 Million (3%)
France ranks sixth on the list, with an import value of $300.11 million, representing 3% of the total global imports. The French construction industry's preference for high-quality and aesthetically pleasing granite drives the demand for this natural stone in the country.
7. United Kingdom: $294.24 Million (2.7%)
The United Kingdom holds the seventh position among the top granite importer countries in 2025, with an import value of $294.24 million, accounting for 2.7% of the global imports. The use of granite in residential and commercial construction projects, as well as in landscaping and urban development, contributes to the growing demand in the UK market.
8. Japan: $286.38 Million (2.6%)
Japan ranks eighth on the list, with an import value of $286.38 million, representing 2.6% of the total global imports, as per Japan granite import data by HS code. The Japanese market's inclination towards natural and durable building materials like granite drives the demand for this stone in the country's construction and design sectors.
9. Libya: $272.95 Million (2.6%)
Libya secures the ninth position among the top granite-importing countries, with an import value of $272.95 million, accounting for 2.6% of the global imports. The use of granite in public infrastructure projects, residential construction, and urban development drives the demand in the Libyan market.
10. Australia: $264.92 Million (2.5%)
Australia rounds up the list of top granite-importing countries in 2025, with an import value of $264.92 million, representing 2.5% of the total global imports. The country's growing construction and renovation activities, along with the popularity of granite in interior design and landscaping, contribute to the increasing demand for this stone in the Australian market.
Global Marble & Granite Importers Database: Top Granite Buyers
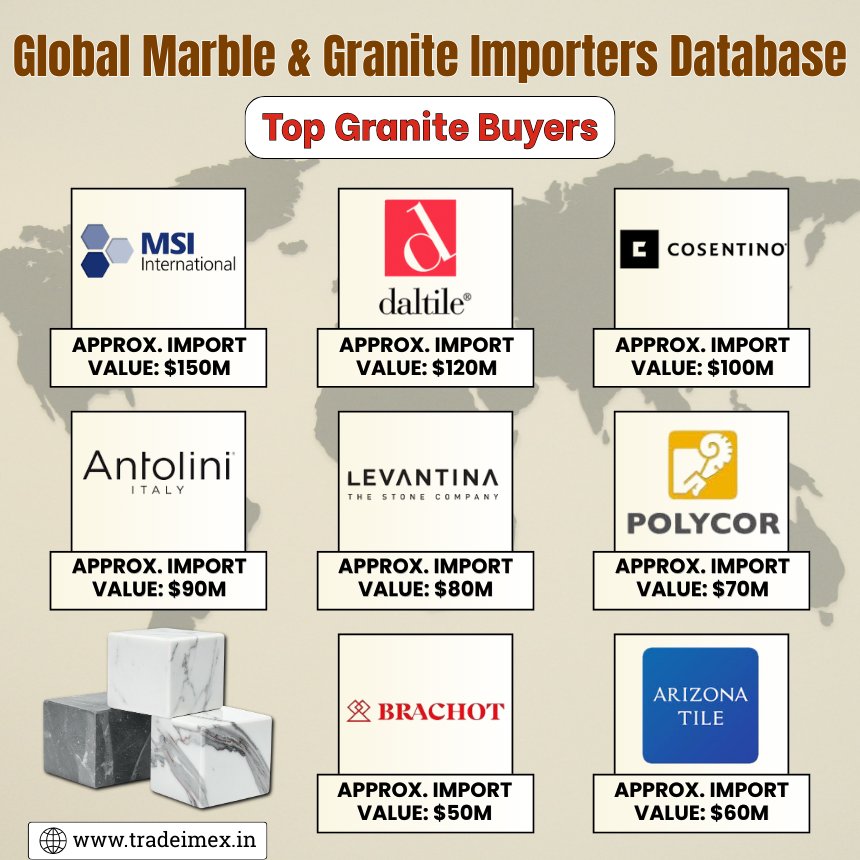
The Global Marble & Granite Importers Database is an invaluable resource for businesses in the stone industry looking to connect with top granite buyers worldwide. This database offers comprehensive information on key players in the granite market, providing insights into their preferences, trends, and purchasing patterns.
With rising interest in importing granite, access to accurate granite import data becomes essential for strategic decisions. Today, global marble and granite importers are focusing on new opportunities in importing marble and granite, supported by increasing marble and granite imports across regions. As demand grows, granite and marble importers are also connecting with trusted marble buyers to strengthen their position in the competitive global market. MS International is the largest granite & marble importer in the world. The leading marble buyers & granite importer companies in the world, as per the granite importers & buyers database for 2025, include:
1. M S International (MSI) (USA)
-
Approx. Import Value: $150M
-
Top Imports: Granite slabs, marble slabs, quartz surfaces
2. Dal-Tile Corporation (USA)
-
Approx. Import Value: $120M
-
Top Imports: Marble tiles, granite tiles, slabs
3. Cosentino Group (Spain)
-
Approx. Import Value: $100M
-
Top Imports: Marble, granite, engineered stone
4. Antolini Luigi & C. S.p.A. (Italy)
-
Approx. Import Value: $90M
-
Top Imports: Premium marble & granite slabs
5. Levantina Group (Spain)
-
Approx. Import Value: $80M
-
Top Imports: Marble blocks, granite slabs
6. Polycor Inc. (Canada)
-
Approx. Import Value: $70M
-
Top Imports: Natural stone (granite & marble blocks/slabs)
7. Brachot Group (Belgium)
-
Approx. Import Value: $50M
-
Top Imports: Granite, marble, engineered stone
8. Arizona Tile (USA)
-
Approx. Import Value: $60M
-
Top Imports: Granite slabs, marble slabs, decorative stone
9. Universal Marble & Granite Group (USA)
-
Approx. Import Value: $45M
-
Top Imports: Marble & granite slabs, custom stone
10. Walker Zanger (USA)
-
Approx. Import Value: $25M
-
Top Imports: Luxury marble, granite, designer stone
Global Granite Imports in the Last 10 Years: Yearly Import Data
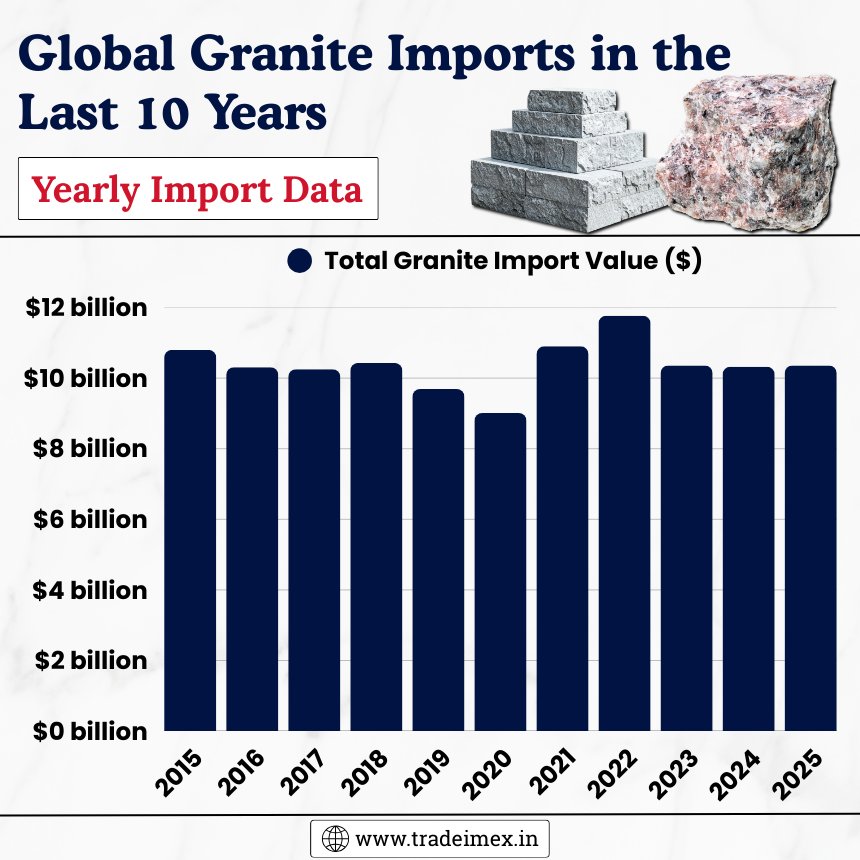
|
Year of Imports |
Total Granite Import Value ($) |
|
2015 |
$10.80 billion |
|
2016 |
$10.31 billion |
|
2017 |
$10.25 billion |
|
2018 |
$10.43 billion |
|
2019 |
$9.69 billion |
|
2020 |
$9.01 billion |
|
2021 |
$10.90 billion |
|
2022 |
$11.77 billion |
|
2023 |
$10.36 billion |
|
2024 |
$10.32 billion |
|
2025 |
$10.36 billion |
Understanding Granite Import Data: What It Really Shows
At its core, granite import data is built from customs records and shipping documentation. Every time a shipment crosses a border, certain details are recorded. When compiled over time, these records create a powerful dataset.
A typical granite import record includes:
-
Importer name and country
-
Exporter or supplier details
-
Product classification (via HS codes)
-
Quantity and weight
-
Shipment value
-
Port of loading and destination
-
Date of shipment
Individually, these records may seem routine. But when aggregated, they reveal extremely useful patterns. For example:
-
A company importing granite every month signals consistent demand
-
A sudden increase in shipments to a country may indicate a construction boom
-
A drop in imports from a specific supplier could suggest pricing or quality issues
This is where importer databases come into play. They organize and structure this raw data so it can be analyzed and acted upon.
Major Importing Regions and Their Buying Behavior
Granite demand is not evenly spread across the globe. Different regions show distinct purchasing patterns based on their economic structure and construction trends.
Asia: High Volume, Processing-Oriented Demand
Asia remains one of the largest import regions, with countries importing significant volumes of raw granite.
-
Large quantities of rough blocks are imported
-
Much of this material is processed and re-exported
-
Cost efficiency and scale are key drivers
This region acts as a manufacturing hub in the granite supply chain.
Europe: Quality-Focused Imports
European countries tend to import both raw and finished granite, but with a strong emphasis on quality and design.
-
High demand for premium finishes
-
Preference for specific textures and colors
-
Strong architectural and aesthetic standards
Import data from Europe often shows higher average prices per shipment, reflecting this quality focus.
North America: Finished Product Dominance
The United States and Canada primarily import finished or semi-finished granite products.
-
Slabs and tiles dominate imports
-
Demand is driven by residential remodeling and commercial projects
-
Consistency and reliability are critical
Import patterns here are often linked to housing market trends and renovation cycles.
Middle East and Emerging Markets: Fast-Growing Demand
Regions in the Middle East, Africa, and parts of Southeast Asia are seeing rapid growth.
-
Infrastructure and mega projects drive demand
-
Imports are increasing year over year
-
Buyers are often exploring new supplier relationships
These markets are especially important for exporters looking to expand.
Export Dynamics: How Supply Meets Demand
On the supply side, granite exports are concentrated among a few key countries with strong natural reserves and established quarrying industries.
These exporters differ in their strengths:
-
Some specialize in raw block exports
-
Others focus on high-value finished products
-
A few manage both ends of the value chain
Import data often reveals interesting shifts in sourcing. For instance:
-
Buyers switching suppliers due to price changes
-
Increasing diversification to reduce dependency on one country
-
Growth in niche varieties of granite
Tracking these shifts can help businesses anticipate market changes before they become obvious.
The Structure of a Granite Importers Database
A well-built importer database is not just a directory. It is a layered system that combines raw trade data with analytical insights.
1. Company Profiles
Each importer is typically profiled with:
-
Business name and address
-
Industry segment (construction, retail, wholesale)
-
Import frequency
-
Estimated purchasing volume
This helps users quickly identify high-potential buyers.
2. Shipment Histories
Historical shipment data shows:
-
How often does a company import
-
What types of granite do they purchase
-
Seasonal patterns in their buying behavior
For example, a company that imports heavily before summer may be preparing for peak construction activity.
3. Supplier Relationships
One of the most valuable insights is understanding who supplies whom.
-
Long-term supplier relationships indicate trust and reliability
-
New supplier entries may signal market testing or dissatisfaction
-
Multiple suppliers suggest diversification strategies
4. Pricing Benchmarks
Import data often includes declared shipment values, which can be used to estimate:
-
Price per ton
-
Price differences across regions
-
Premium vs budget segments
This is especially useful for negotiation and market positioning.
How Businesses Use Granite Import Data in Practice
The real value of this data comes from how it is applied.
Targeted Market Entry
Instead of entering a new country blindly, businesses can:
-
Identify active importers
-
Focus on those with consistent demand
-
Prioritize companies already importing similar products
This reduces time and increases success rates.
Smarter Sales Outreach
Sales teams can move away from generic outreach and focus on:
-
Companies that recently imported granite
-
Buyers who are increasing their order volumes
-
Importers who may be switching suppliers
This approach is far more efficient than cold prospecting.
Competitive Intelligence
Our Import data provides a window into competitor activity.
You can see:
-
Which companies are your competitors supplying to
-
How frequently are they shipping
-
Whether they are expanding into new markets
This helps businesses refine their own strategies.
Supply Chain Optimization
Importers themselves benefit by analyzing:
-
Alternative suppliers
-
Faster shipping routes
-
Cost-saving opportunities
Even small adjustments in sourcing or trade can lead to significant savings.
Key Trends Shaping Granite Imports in 2025
Several trends are influencing how granite is traded globally.
1. Increased Use of Data in Decision-Making
More companies are relying on data rather than intuition. Decisions about suppliers, markets, and pricing are increasingly backed by evidence.
2. Diversification of Supply Chains
Recent global disruptions have pushed businesses to avoid relying on a single supplier or country.
3. Rising Demand for Customization
Buyers are looking for specific finishes, colors, and dimensions. This is reflected in import data through more varied product descriptions.
4. Price Sensitivity
With fluctuating costs in trade and raw materials, buyers are more price-conscious. This leads to frequent supplier comparisons.
5. Sustainability Considerations
There is growing awareness around environmental impact. While this has not drastically reduced imports, it is influencing sourcing decisions.
Challenges in Using Granite Import Data
Despite its value, working with import data is not always straightforward.
Data Volume
The sheer amount of data can be overwhelming. Without proper filtering, it is difficult to extract useful insights.
Data Gaps
Not all records are complete. Some shipments may have missing or generalized information.
Interpretation
Data does not speak for itself. It requires analysis to turn it into meaningful conclusions.
The Future of Granite Imports
Looking ahead, the role of data in the granite trade will only grow.
We can expect:
1. Steady Growth with Higher Value: Global granite imports will grow at 4% CAGR, with a shift toward premium and finished products increasing average shipment value.
2. Data-Driven Trade Decisions: With 350,000+ annual shipments tracked, buyers and exporters will rely heavily on data for targeting, pricing, and supplier selection.
3. Diversified and Resilient Supply Chains: Importers are reducing risk by sourcing from multiple countries, especially after 10–15% supply disruptions were seen in recent years.
4. Emerging Markets Driving Demand: Regions like the Middle East, Africa, and Southeast Asia are growing at 5–8% annually, creating new opportunities beyond traditional markets.
Conclusion and Final Thoughts
In conclusion, granite imports in 2025 are part of a complex, global system driven by both physical trade and digital intelligence. The key takeaway is simple: access to data is no longer the advantage. The advantage lies in how effectively that data is used. A well-structured global marble and granite importers database offers more than just information. It provides clarity on market behavior, buyer needs, and competitive dynamics. For businesses willing to invest the time to understand it, this data becomes a powerful tool for growth, efficiency, and strategic decision-making.
Note for Our Readers
We hope this detailed analysis of granite imports in 2025, along with insights into global trade trends, key importing companies, pricing dynamics, and the role of importer databases, has given you a clearer understanding of how the marble and granite trade is evolving worldwide. If you’re looking for deeper insights into global granite and marble import-export data by country, shipment-level trends, pricing benchmarks, port activity, and a verified database of active importers and buyers, having access to structured trade data can significantly strengthen your market research and business decisions.
For inquiries, collaborations, or to explore how data-driven insights can support your sourcing, sales, or expansion strategy in the natural stone industry, feel free to reach out at info@tradeimex.in and take the next step toward smarter global trade decisions.
Share
What's Your Reaction?
 Like
1
Like
1
 Dislike
1
Dislike
1
 Love
1
Love
1
 Funny
1
Funny
1
 Angry
1
Angry
1
 Sad
1
Sad
1
 Wow
1
Wow
1