Global Cosmetic Import Export Data: Top Cosmetic Importers & Exporters in 2024-25
Explore the latest global cosmetic trade data for 2024-25, covering the top cosmetic importers & exporters, key trends, & import-export data insights.
In the ever-evolving world of beauty and personal care products, the global cosmetic industry continues to thrive. With advancements in technology, changing consumer preferences, and a rise in beauty influencers, the demand for cosmetics is at an all-time high. As a result, the import and export data of cosmetic products have become crucial for businesses looking to capitalize on the booming industry of Cosmetics trade, as per the Global Beauty and Cosmetics Association.
According to Cosmetic import data and global trade data, the total value of global cosmetic imports reached $74.89 billion in 2024, a 2% decline from the previous year, while global cosmetic exports accounted for $74.22 billion in 2024, a decline of 1% from the previous year, as per the cosmetic export data. In this article, we will explore the top cosmetic importers and exporters in 2024-25 based on global cosmetic import-export data.
Top 10 Cosmetic Importing Countries: Cosmetic Imports by Country
When examining the Top 10 Cosmetic Importing Countries based on Cosmetic Imports by Country, one can observe a dynamic global market where beauty products hold significant importance. These top importing countries play a crucial role in the cosmetics industry, shaping trends and driving demand. From countries like the United States and China to Japan and Germany, each nation contributes uniquely to the cosmopolitan landscape of beauty products. The top 10 cosmetic importer countries in 2024-25, as per the cosmetic import shipment data and trade data on import of cosmetics, include:
- China: $13.02 billion (17.4%)
China tops the list as the largest cosmetic importing country, with an impressive $13.02 billion in cosmetic imports for the year 2024-25. The Chinese market has a high demand for skincare and makeup products, making it a lucrative market for cosmetic companies around the world.
- USA: $7.79 billion (10.4%)
The United States comes in second place, with $7.79 billion in cosmetic imports, as per the US cosmetic import data. The US market is known for its diverse range of cosmetic products, catering to a wide variety of consumers and many companies importing cosmetics into the US who import cosmetics to USA. With a strong economy and a large population, the demand for imported cosmetics in the US remains high.
- Hong Kong: $4.03 billion (5.4%)
Hong Kong is a major player in the cosmetic industry, with $4.03 billion in cosmetic imports for the year 2024-25. The region's proximity to China and its status as a global financial hub make it a popular destination for cosmetic companies looking to enter the Asian market.
- Germany: $3.15 billion (4.2%)
Germany ranks fourth on the list, with $3.15 billion in cosmetic imports, as per Germany cosmetic import data. The German market is known for its high-quality skincare and haircare products, attracting consumers from all over the world. With a strong focus on innovation and sustainability, Germany remains a key player in the global cosmetic industry.
- United Kingdom: $3.07 billion (4.1%)
The United Kingdom follows closely behind Germany, with $3.07 billion in cosmetic imports. The UK market is known for its love of luxury beauty brands and innovative cosmetic products. With a growing focus on clean and natural beauty, the UK continues to be a strong market for cosmetic imports.
- France: $2.73 billion (3.7%)
France is famous for its beauty and skincare products, making it a key player in the global cosmetic industry. With $2.73 billion in cosmetic imports for the year 2024-25, France remains a popular destination for cosmetic companies looking to showcase their products in the European market, importing French cosmetics.
- Singapore: $2.68 billion (3.6%)
Singapore is a thriving market for cosmetics, with $2.68 billion in cosmetic imports. The country's strategic location in Southeast Asia and its reputation as a shopping paradise make it a popular destination for cosmetic brands looking to expand their presence in the region.
- Canada: $1.99 billion (2.7%)
Canada ranks eighth on the list, with $1.99 billion in cosmetic imports. The Canadian market is known for its diverse consumer base and growing demand for natural and cruelty-free beauty products. With a focus on sustainability and inclusivity, Canada remains a key player in the global cosmetic industry.
- Netherlands: $1.89 billion (2.5%)
The Netherlands is a small but influential market for cosmetics, with $1.89 billion in cosmetic imports. The Dutch market is known for its love of innovative beauty products and its environmentally conscious consumer base. With a focus on clean beauty and sustainability, the Netherlands continues to attract cosmetic companies from around the world.
- Japan: $1.80 billion (2.4%)
Japan rounds out the list of the top 10 cosmetic-importing countries, with $1.80 billion in cosmetic imports. The Japanese market is known for its skincare innovations and beauty rituals, making it a popular destination for cosmetic companies looking to tap into the Asian market. With a strong focus on quality and efficacy, Japan remains a key player in the global cosmetic industry.
Top 10 Cosmetic Exporting Countries: Cosmetic Exports by Country
When looking at the top 10 cosmetic exporting countries, it is clear that the beauty industry is thriving globally. These countries are making significant contributions to the cosmetic market, exporting quality products that appeal to consumers worldwide. From powerhouse nations like the United States and France to emerging markets like South Korea and Japan, each country brings its unique expertise and innovation to the beauty industry. The top 10 cosmetic exporter countries, as per the data on cosmetic exports by country and cosmetic export shipment data for 2024-25, include:
- France: $12.20 billion (16.4%)
France holds the top spot as the leading cosmetic exporting country, with an impressive export value of $12.20 billion, accounting for 16.4% of the total global cosmetic exports, as per France cosmetic export data. Renowned for its luxury beauty brands and high-quality skincare products, France continues to dominate the global cosmetic market.
- South Korea: $8.57 billion (11.6%)
South Korea has emerged as a key player in the cosmetic industry, with a total export value of $8.57 billion, representing 11.6% of the global cosmetic exports. K-beauty products, known for their innovative ingredients and advanced formulations, have gained popularity worldwide, contributing to South Korea's success in the export market.
- USA: $6.19 billion (8.3%)
The United States ranks third among the top cosmetic exporting countries, with an export value of $6.19 billion, making up 8.3% of the total global cosmetic exports, as per the US cosmetic export data. With a diverse range of beauty brands and a strong presence in the global market, the USA continues to be a major player in the cosmetic industry.
- Singapore: $4.92 billion (6.6%)
Singapore is a rising star in the cosmetic export market, with a total export value of $4.92 billion, accounting for 6.6% of the global cosmetic exports. Known for its efficient exports and strategic location, Singapore has become a hub for cosmetic exports in the Asia-Pacific region.
- Germany: $4.77 billion (6.4%)
Germany holds the fifth position among the top cosmetic exporting countries, with an export value of $4.77 billion, representing 6.4% of the total global cosmetic exports. German beauty brands are celebrated for their high-quality standards and innovative product offerings, making them popular among consumers worldwide.
- China: $4.08 billion (5.5%)
China's cosmetic export market continues to grow steadily, with a total export value of $4.08 billion, making up 5.5% of the global cosmetic exports. As one of the largest cosmetics markets in the world, China's booming beauty industry has paved the way for increased exports in recent years.
- Hong Kong: $3.37 billion (4.5%)
Hong Kong remains a significant player in the cosmetic export market, with an export value of $3.37 billion, accounting for 4.5% of the global cosmetic exports. With its strategic location and well-established trade networks, Hong Kong serves as a key trading hub for cosmetic products in the region.
- Italy: $3.11 billion (4.2%)
Italy is renowned for its luxury beauty brands and high-quality cosmetics, contributing to its total export value of $3.11 billion, representing 4.2% of the global cosmetic exports. Italian beauty products are synonymous with sophistication and style, attracting consumers from around the world.
- Japan: $2.79 billion (3.8%)
Japan's cosmetic export market continues to make strides, with an export value of $2.79 billion, making up 3.8% of the global cosmetic exports. Japanese beauty brands are known for their focus on traditional skincare rituals and cutting-edge technology, appealing to a diverse consumer base.
- Poland: $2.72 billion (3.7%)
Poland rounds out the list of the top 10 cosmetic exporting countries, with an export value of $2.72 billion, accounting for 3.7% of the total global cosmetic exports. With a growing reputation for high-quality cosmetic products and competitive pricing, Poland has emerged as a key player in the global beauty industry.
Top 10 Cosmetic Import Companies: Cosmetic Importers Database
The Cosmetic Importers Database provides a comprehensive roster of leading cosmetic importers, offering a valuable resource for businesses in the beauty industry looking to expand globally. These top companies have established a strong presence in the market, showcasing expertise and reliability in importing high-quality cosmetic products. The top 10 biggest cosmetic importing companies in 2025, as per the cosmetic importers database and cosmetic buyers list, include:
|
Rank |
Company |
Approx Import Value 2024-25 ($) |
Top Source Countries |
Key Products |
|
1 |
$70 billion |
France, USA, SK, China |
Makeup, skincare |
|
|
2 |
IVIA Beaute Pvt Ltd |
$62 billion |
France, SK, USA, UK |
Makeup, skincare |
|
3 |
Ziri Tradelink Pvt Ltd |
$10 billion |
France, China |
Skin prep, makeup |
|
4 |
Brillare Science Pvt Ltd |
$4 billion |
EU, USA, SK |
Skincare, wellness |
|
5 |
The Himalaya Drug Company |
$2.5 billion |
India (domestic), France |
Herbal skincare |
|
6 |
VLCC Personal Care Ltd |
$2.2 billion |
India, EU |
Personal care |
|
7 |
Hegde & Hegde Pharmaceutica LLP |
$2 billion |
India, China |
Pharma-cosmetics |
|
8 |
Aminu Wellness Pvt Ltd |
$1 billion |
India, EU |
Wellness skincare |
|
9 |
Lord’s Homoeopathic Lab Pvt Ltd |
$750 million |
India |
Homeopathic skincare |
|
10 |
Aimil Ayouthveda Ltd |
$600 million |
India, EU |
Ayurvedic skincare |
Top 10 Cosmetic Export Companies: Cosmetic Exporters Database
The Cosmetic Exporters Database provides valuable insight into the leading players in the cosmetic export industry. This database showcases the top companies excelling in exporting cosmetics, offering a comprehensive overview of their beauty products, services, and global reach. The leading cosmetic exporting companies, as per the cosmetic exporters database and cosmetic suppliers list for 2025, include:
|
Rank |
Exporter |
Approx Export Value 2024-25 ($) |
Top Market Destinations |
Key Products |
|
1 |
$14 billion |
China, USA, Germany |
Luxury skincare & makeup |
|
|
2 |
Amorepacific / LG H&H (S. Korea) |
$8.5 billion |
USA, EU, China |
K-beauty skincare |
|
3 |
Estée Lauder Companies (USA) |
$7 billion |
EU, Canada, Asia |
Premium skincare & makeup |
|
4 |
Shiseido Co. (Japan) |
$5.2 billion |
USA, China, Southeast Asia |
Skincare, luxury cosmetics |
|
5 |
Coty Inc. (USA/Europe) |
$5 billion |
Global |
Makeup and fragrances |
|
6 |
Procter & Gamble (USA) |
$4.5 billion |
Global |
Skincare and personal care |
|
7 |
Unilever (UK/Netherlands) |
$4 billion |
Global |
Beauty & personal care |
|
8 |
Beiersdorf AG (Germany) |
$3.2 billion |
EU, USA |
Skin care (Nivea, Eucerin) |
|
9 |
Cocoon (Italy) |
$2.5 billion |
EU |
Luxury cosmetics |
|
10 |
Natura & Co (Brazil) |
$1.5 billion |
Latin America, US, Canada |
General cosmetics |
Insights & Context
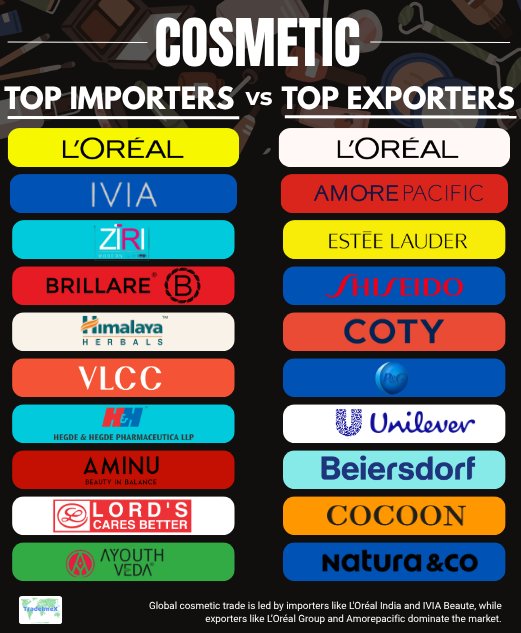
- Importer companies like L’Oréal India and IVIA import $60–70 billion annually, on par with major global volumes, serving domestic and regional markets.
- Exporter companies are mostly headquartered in cosmetics-export powerhouse countries, France, South Korea, the US, and Japan.
- Leading exporters include global corporate giants such as L’Oréal Group, Estée Lauder, Shiseido, etc., with $5–14 billion in annual cosmetic exports.
Cosmetic Imports by HS Code: Top Cosmetic Import Categories
When examining Cosmetic Imports by HS Code, it's imperative to identify the Top Cosmetic Import Categories for detailed analysis. By understanding the specific HS codes associated with these categories, businesses can enhance their insights into the nuances of importing cosmetics. The top imported cosmetic categories globally, as per the cosmetic import data by HS code and global cosmetic import statistics for 2024-25, include:
- Beauty or make-up preparations/Skincare (HS Code 330499): $59.01 billion
- Lip make-up preparations (HS Code 330410): $6.04 billion
- Eye make-up preparations (HS Code 330420): $5.35 billion
- Make-up or skin care powders (HS Code 330491): $2.97 billion
- Manicure or pedicure preparations (HS Code 330430): $1.48 billion
Cosmetic Exports by HS Code: Top Cosmetic Export Categories
When delving into Cosmetic Exports by HS Code, it is crucial to identify the top Cosmetic Export Categories to streamline trade and analysis. By focusing on the core Cosmetic Export Categories outlined through HS Codes, companies can strategically navigate international markets and enhance their competitiveness. The major cosmetic export categories in 2024-25, as per the cosmetic export data by HS code and cosmetic export statistics, include:
- Beauty or make-up preparations/Skincare (HS Code 330499): $59.03 billion
- Lip make-up preparations (HS Code 330410): $5.74 billion
- Eye make-up preparations (HS Code 330420): $4.89 billion
- Make-up or skin care powders (HS Code 330491): $2.91 billion
- Manicure or pedicure preparations (HS Code 330430): $1.61 billion
Cosmetic Import-Export Data in the Last 10 Years: Yearly Cosmetics Trade Data

|
Year of Exports |
Cosmetic Import Value ($) |
Cosmetic Export Value ($) |
|
2014 |
$38.21 billion |
$38.06 billion |
|
2015 |
$38.25 billion |
$37.91 billion |
|
2016 |
$42.56 billion |
$42.52 billion |
|
2017 |
$48.83 billion |
$49.57 billion |
|
2018 |
$58.48 billion |
$59.23 billion |
|
2019 |
$62.62 billion |
$63.76 billion |
|
2020 |
$64.92 billion |
$62.20 billion |
|
2021 |
$74.61 billion |
$71.53 billion |
|
2022 |
$74.19 billion |
$70.12 billion |
|
2023 |
$76.64 billion |
$74.69 billion |
|
2024 |
$74.89 billion |
$74.22 billion |
Top 10 Cosmetic Brands in the World (FY 2024–25)
|
Rank |
Brand |
Parent Company |
Approx. Annual Revenue (2024–25) |
|
1 |
L’Oréal Paris |
L’Oréal Group |
$44.7 billion |
|
2 |
Chanel Beauty |
Chanel Ltd. |
$18–19 billion |
|
3 |
Estée Lauder |
Estée Lauder Companies |
$17.5 billion |
|
4 |
Olay |
Procter & Gamble (P&G) |
$12–13 billion |
|
5 |
Nivea |
Beiersdorf AG |
$9.5–10.5 billion |
|
6 |
Gillette |
Procter & Gamble (P&G) |
$8.4 billion |
|
7 |
Shiseido |
Shiseido Co., Ltd. |
$7.2 billion |
|
8 |
Dove |
Unilever |
$6.5–7 billion |
|
9 |
e.l.f. Cosmetics |
e.l.f. Beauty Inc. |
$1.3 billion |
|
10 |
Fenty Beauty |
Kendo (LVMH) / Rihanna |
$600–650 million |
Global Cosmetic Trade Overview
- Export volume: 2.7 million tons in 2024, down 15.2% from 2023’s 3.2 M tons.
- Export value: $74.22 billion in 2024 vs $74.9 billion in 2023.
- Import volume: 2.9 million tons in 2024, down 11.8% from 2023’s 3.3 M tons.
- Import value: $74.89 billion in 2024 (peak was $77.8 billion in 2023).
Cosmetic Shipment Data & Product Breakdown
Import types (2024):
- Skin care/make‑up prep: 2.5 million tons (85%), value $54.9 billion
- Lip make‑up: 113 K tons, $5.4 billion
- Eye make‑up: 109 K tons, $5 billion
Export types (2024):
- Skin care/make‑up prep: 2.4 million tons (85%), value $53.4 billion
- Lip make‑up: 103 K tons, $4.7 billion
- Eye make‑up: 95 K tons, $5 billion
Cosmetic Trade Trends & Dynamics
- China-US tariffs: Korean & EU products facing 10–25% duties, US imports of Korean cosmetics soared past France in 2024 despite tariffs, as per the data on US cosmetic imports from South Korea.
- Chinese outbound M&A: Brands like Proya and S'Young are investing in foreign acquisitions to boost exports.
- EU–US trade friction: Proposed 25% EU tariffs on US beauty goods could trigger supply chain shifts.
- Slowdown after boom: After record peaks in 2023, 2024 saw declining volumes & values, indicating possible saturation or macro pressures.
- Shifting importer landscape: Netherlands, China, India & Mexico rising fastest; Germany, UK slipping.
Insights & Outlook
- Downturn in 2024, but underlying structural growth continues: global cosmetics market projected to reach $677 billion in 2025.
- Diversification is key: Exporters hedge against geopolitical/tariff risks by focusing on emerging markets and private-label strategies.
- K‑Beauty momentum: Korea surging past France as top US exporter in 2024; strong online channels, despite tariffs.
- Premium M&A: Giants like L’Oréal acquiring Medik8 (€1 B) to broaden dermo-cosmetic portfolio.
- Trade policy friction: EU & US tariff threats could reshape supply chains, pricing, and R&D allocation.
- Future resilience: Firms investing in innovation, DTC/online, personalized offerings, and market diversification.
Summary of Global Cosmetic Import-Export Trade
- 2024 marked a softening after the 2023 boom: global cosmetic trade dropped by 15%.
- France, South Korea, USA remain the largest exporters; China, the USA, and Hong Kong lead imports.
- Korean brands are gaining ground in the US; the EU is challenged by tariffs.
- M&A and innovation define 2025: expect consolidation, premiumization, and resilience through diversification, as per the reports of the International Cooperation on Cosmetics Regulation.
The Future of the Cosmetic Industry
As we look ahead to 2025 and beyond, the cosmetic industry shows no signs of slowing down. With advancements in technology, sustainability initiatives, and a growing focus on wellness and self-care, the beauty market is set to expand even further. By staying informed on global import-export data and tracking the top cosmetic importers and exporters, businesses can position themselves for success in this competitive and dynamic industry.
Conclusion and Final Thoughts
In conclusion, the beauty industry is a vibrant and ever-changing landscape. Global cosmetic import-export data provides valuable insights for businesses looking to navigate this complex market and stay ahead of the competition. By understanding the trends and key players in the industry, companies can make strategic decisions that drive growth and innovation.
We hope that you liked our interactive & insightful blog report on cosmetic import-export data, highlighting the top cosmetic importers & exporters in 2024-25. Visit TradeImeX for more such trade trends and access the global trade data with ease. Contact us at info@tradeimex.in to get the latest customized database reports, along with the verified list of top cosmetic importers & top cosmetic exporters.
Share
What's Your Reaction?
 Like
0
Like
0
 Dislike
0
Dislike
0
 Love
0
Love
0
 Funny
0
Funny
0
 Angry
0
Angry
0
 Sad
0
Sad
0
 Wow
0
Wow
0