Russia Oil Exports Data 2025: Russia Oil Production & Russian Oil Suppliers Database
Explore Russia oil exports data, including Russia oil exports by country, & a comprehensive database of Russian oil suppliers with global market trends.
Russia’s oil sector in 2025 sits at the center of a reshaped global energy system. Since 2022, sanctions, price caps, and trade realignments have forced Russia to rebuild its export model from the ground up. What makes 2025 significant is not a collapse in output or exports, but a structural transformation in who buys Russian oil, how it is transported, and how it is priced. According to the Russia export data and Russia customs export data of oil, the total value of Russia oil exports reached $122 billion in 2025.
This analysis provides a data-driven breakdown of Russia’s export data, Russian oil production, export volumes, trade routes, supplier ecosystem, & the emerging “shadow infrastructure” that sustains its global position in oil trade.
Russia Oil Production Data 2025
Russia remains one of the top three oil producers globally alongside the United States and Saudi Arabia. Russia is also the 2nd largest exporter of oil in the world, according to global trade data and the IEA report on Russia's oil exports.
Key Production Metrics (2025)
-
Average crude production: 9.1–9.3 million barrels per day (bpd)
-
Liquids production (including condensates): 10.5 million bpd
-
Annual output: 530 million metric tons
-
Year-on-year change: −0.5% to −1%
Production stability in 2025 reflects deliberate policy choices rather than market freedom.
OPEC+ Compliance
Russia continues to operate under OPEC+ agreements, maintaining partial voluntary cuts of approximately:
-
300,000–500,000 bpd (varies monthly)
These cuts are not purely restrictive. They serve two purposes:
-
Support global oil prices
-
Offset reduced export margins caused by discounts
Field-Level Stability
Russia’s mature oil fields in Western Siberia continue to dominate output:
-
West Siberian Basin: 60% of production
-
Volga-Urals region: 20%
-
Eastern Siberia & Far East: growing share (15–18%)
New projects in Eastern Siberia are strategically important because they connect directly to Asian markets via pipeline infrastructure.
Total Oil Exports: Volume vs Revenue
Russia’s export strategy in 2025 prioritizes volume preservation over revenue optimization.
Export Volume Data
-
Total crude exports: 238 million metric tons
-
Equivalent barrels: 4.8–5 million bpd exported
-
Change vs 2024: nearly flat
Export Revenue Trends
Despite stable volumes:
-
Monthly oil export revenues dropped to the $10–12 billion range
-
Estimated annual oil export revenue: $140–160 billion
-
Decline vs pre-2022 levels: −25% to −35%
Key Insight: Russia is effectively trading price for market access. Discounts and higher export costs mean:
-
Lower netbacks per barrel
-
Higher dependency on fewer buyers
Russia Oil Exports by Country: Where Does Russia Export Oil?
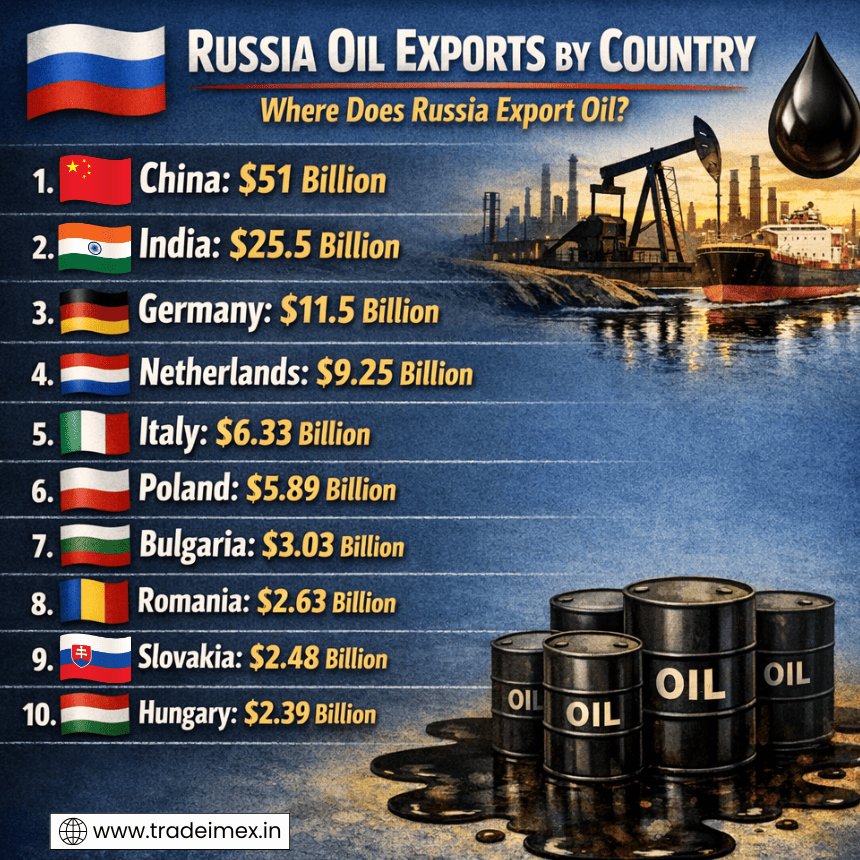
Russia is a key player in the global oil market, with its oil exports reaching various countries worldwide. As one of the world's leading producers of oil, Russia's exports are actively monitored by global energy markets. The top destinations for Russia's oil exports include China, India, Germany, and Poland. These countries rely on Russia for a significant portion of their oil supply, highlighting Russia's crucial role in the international energy trade. The top 10 export destinations for Russian oil, as per the Russia oil shipment data and Russia customs data for 2025, include:
1. China: $51 billion (38.4%)
China, with its rapidly growing economy and increasing energy demands, is the largest importer of Russian oil, as per the data on Russia oil exports to China by HS code. The proximity of the two countries and the well-established trade relations between them have made China a natural market for Russian oil exports. With billions of dollars worth of oil flowing from Russia to China every year, this partnership is crucial for both countries' energy security.
2. India: $25.5 billion (19.2%)
India, another major player in the global economy, relies on imported oil to meet its energy needs. Russia is a key supplier of oil to India, with billions of dollars' worth of oil being shipped to Indian ports every year. The strategic partnership between Russia and India in the energy sector has helped strengthen the bilateral relations between the two countries.
3. Germany: $11.5 billion (8.68%)
Germany, as one of the largest economies in Europe, is a key market for Russian oil exports. The strong industrial base in Germany requires a steady supply of oil, & Russia has been a reliable partner in meeting this demand. The geographic proximity of Russia to Germany has also made the transportation of oil more cost-effective, further solidifying the trade relationship between the two countries.
4. Netherlands: $9.25 billion (6.97%)
The Netherlands serves as an important transit hub for Russian oil exports to other European countries. The well-developed infrastructure and strategic location of the Netherlands make it an ideal entry point for Russian oil to reach markets across Europe. The Netherlands also has a significant refining capacity, making it an attractive destination for Russian crude oil.
5. Italy: $6.33 billion (4.77%)
Italy, with its strong manufacturing and industrial base, is a key importer of Russian oil. The stable trade relations between Russia and Italy have allowed for a steady flow of oil from Russia to Italian ports. The demand for Russian oil in Italy continues to grow, further strengthening the economic ties between the two countries.
6. Poland: $5.89 billion (4.44%)
Poland, as a neighboring country to Russia, has historically been a major importer of Russian oil. The geographical proximity and well-established trade routes between the two countries have facilitated the transportation of oil from Russia to Poland. The energy cooperation between Russia and Poland is vital for ensuring the energy security of both countries.
7. Bulgaria: $3.03 billion (2.28%)
Bulgaria, with its growing energy needs, relies on imported oil to fuel its economy. Russia is a key supplier of oil to Bulgaria, with billions of dollars' worth of oil being shipped to Bulgarian ports every year. The trade relationship between Russia and Bulgaria continues to strengthen, benefiting both countries economically.
8. Romania: $2.63 billion (1.98%)
Romania is another important market for Russian oil exports in Europe. The well-established trade relations between Russia and Romania have allowed for a smooth flow of oil from Russia to Romania. The energy partnership between the two countries plays a crucial role in meeting Romania's energy needs and strengthening economic ties between the two nations.
9. Slovakia: $2.48 billion (1.87%)
Slovakia, with its growing industrial base, relies on imported oil to power its economy. Russia is a key supplier of oil to Slovakia, with billions of dollars' worth of oil being shipped to Slovakian ports every year. Energy cooperation between Russia and Slovakia has helped ensure a stable energy supply for Slovakia.
10. Hungary: $2.39 billion (1.8%)
Hungary, located in Central Europe, is a key importer of Russian oil, as per the data on Russia oil exports to Hungary. The strong trade relations between Russia and Hungary have made Russia a reliable supplier of oil to Hungary. The demand for Russian oil in Hungary continues to grow, contributing to the economic prosperity of both countries.
Russia Oil Exporters Database: Top Oil Suppliers in Russia
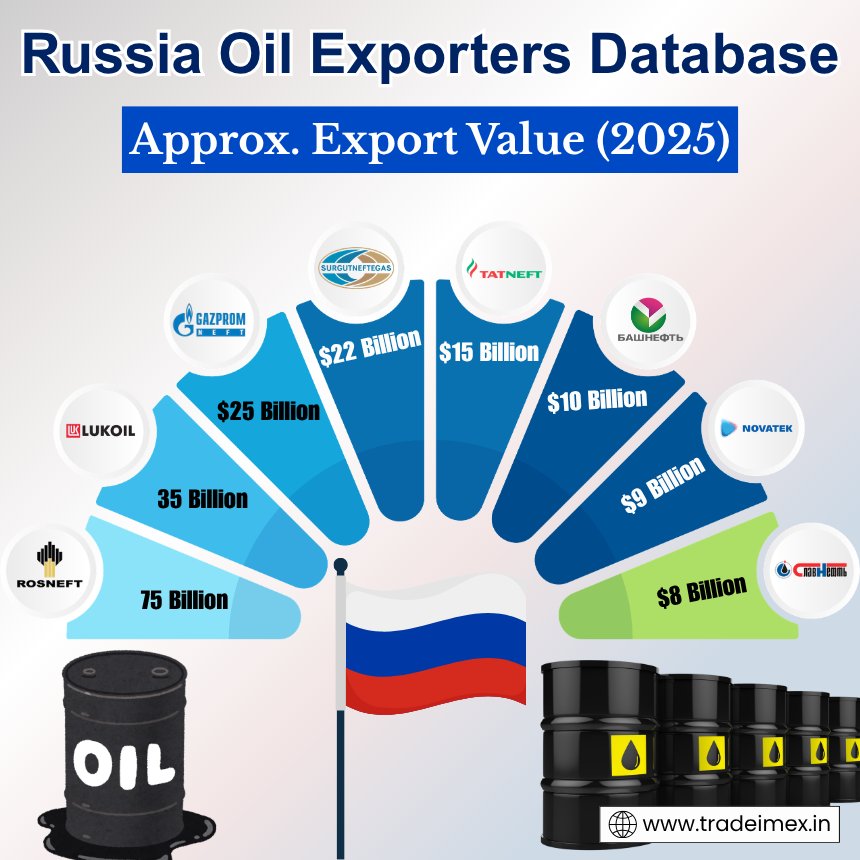
The Russia Oil Exporters Database provides valuable insights into the top oil suppliers in Russia, making it a go-to resource for industry professionals and researchers. This database offers detailed information on key players in the Russian oil market, helping users stay informed and make well-informed decisions. Rosneft is the biggest oil supplier in Russia. The top 10 Russian oil suppliers, according to the Russia oil suppliers data & oil exporters records for 2025, include:
1. Rosneft
-
Approx. Export Value (2025): 75 Billion
-
Top Export Types: Crude oil (Urals, ESPO), fuel oil
-
Top Export Destinations: China, India
2. Lukoil
-
Approx. Export Value (2025): 35 Billion
-
Top Export Types: Crude oil, diesel, gasoline
-
Top Export Destinations: Turkey, India, and limited Europe
3. Gazprom Neft
-
Approx. Export Value (2025): $25 Billion
-
Top Export Types: Crude oil, refined petroleum products
-
Top Export Destinations: China, India
4. Surgutneftegas
-
Approx. Export Value (2025): $22 Billion
-
Top Export Types: Crude oil
-
Top Export Destinations: China, broader Asian markets
5. Tatneft
-
Approx. Export Value (2025): $15 Billion
-
Top Export Types: Crude oil, petrochemicals
-
Top Export Destinations: Turkey, Eastern Europe, Asia
6. Bashneft (Rosneft subsidiary)
-
Approx. Export Value (2025): $10 Billion
-
Top Export Types: Crude oil, refined fuels
-
Top Export Destinations: India, select international markets
7. Novatek (liquids segment)
-
Approx. Export Value (2025): $9 Billion
-
Top Export Types: Gas condensate, light crude
-
Top Export Destinations: Asia, Europe
8. Slavneft
-
Approx. Export Value (2025): $8 Billion
-
Top Export Types: Crude oil
-
Top Export Destinations: China, Eastern Europe
9. RussNeft
-
Approx. Export Value (2025): $5 Billion
-
Top Export Types: Crude oil
-
Top Export Destinations: Asia, CIS countries
10. Zarubezhneft
-
Approx. Export Value (2025): $4 Billion
-
Top Export Types: Crude oil, offshore production blends
-
Top Export Destinations: India, China, the Middle East
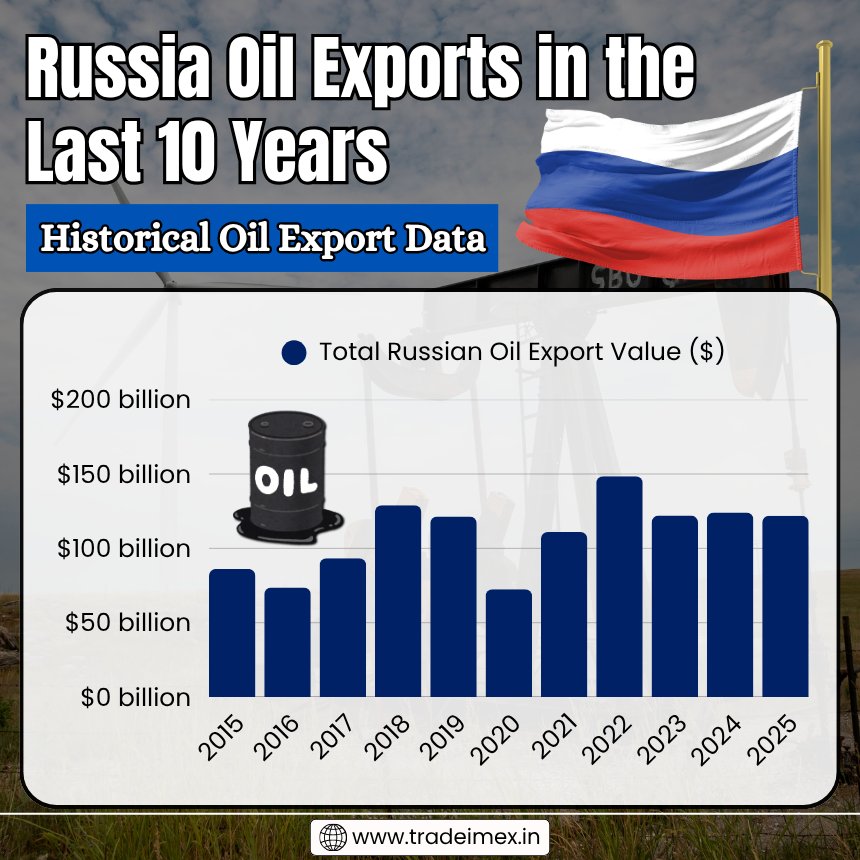
Russia Oil Exports in the Last 10 Years: Historical Oil Export Data
|
Year of Exports |
Total Russian Oil Export Value ($) |
|
2015 |
$86.17 billion |
|
2016 |
$73.67 billion |
|
2017 |
$93.30 billion |
|
2018 |
$129.04 billion |
|
2019 |
$121.44 billion |
|
2020 |
$72.56 billion |
|
2021 |
$110.96 billion |
|
2022 |
$148.51 billion |
|
2023 |
$122.03 billion |
|
2024 |
$124.14 billion |
|
2025 |
$122 billion |

Regional Export Breakdown
The most dramatic shift in the Russian oil trade is geographic.
Export Distribution (2025)
-
China: 45–50%
-
India: 30–35%
-
Turkey & Middle East: 10%
-
Europe: <10%
Europe’s Collapse
Before 2022:
-
Europe imported 50–60% of Russian crude
In 2025:
-
Imports reduced to 20–25 million tons annually
This decline is driven by:
-
EU embargo on seaborne crude
-
Gradual reduction of pipeline imports
-
Substitution with Middle Eastern and U.S. crude
India’s Role as a Refining Hub
India has emerged as a central player in Russia’s oil export system.
Import Growth
-
Pre-2022: <2% of Russian exports
-
2025: 30–35% share
Refining the Arbitrage Model
India buys discounted Russian crude and exports refined products:
-
Diesel
-
Jet fuel
-
Gasoline
Some of these refined products are indirectly consumed in Europe, creating a circular trade system.
Pricing Advantage
-
Russian Urals crude discount: $8–15 per barrel vs Brent
-
Indian refiners benefit from:
-
Lower input costs
-
Strong global demand for refined fuels
China: The Anchor Buyer
China is Russia’s most important long-term oil customer.
Import Channels
-
ESPO Pipeline (Eastern Siberia–Pacific Ocean)
-
Seaborne shipments via Pacific ports
Key Data
-
China accounts for 48% of Russia’s fossil fuel export revenue
-
Long-term contracts stabilize demand
Strategic Importance
China offers:
-
Payment flexibility (yuan settlements)
-
Stable demand
-
Infrastructure integration
Export Infrastructure: Pipelines vs Seaborne Trade
Russia’s oil exports rely on two main systems.
Pipeline Exports
Major Pipelines
-
Druzhba Pipeline: Europe
-
ESPO Pipeline: China
Trends
-
Declining European pipeline flows
-
Increasing reliance on ESPO for Asian markets
Seaborne Exports
Key Ports
-
Baltic: Ust-Luga, Primorsk
-
Black Sea: Novorossiysk
-
Pacific: Kozmino
Share of Exports
-
Seaborne shipments account for 70–75% of total exports
Advantage
-
Flexibility to redirect cargo
-
Access to global markets
Shadow Fleet and Sanctions Evasion
One of the defining features of Russia’s oil trade in 2025 is the expansion of the shadow fleet.
Fleet Data
-
Total tankers involved: 300+
-
Shadow fleet vessels: 100–120
-
Share of crude transported: up to 40–45%
Characteristics
-
Older ships (15–20 years old)
-
Non-Western insurance
-
Frequent ship-to-ship transfers
Operational Impact
The shadow fleet allows Russia to:
-
Bypass G7 price caps
-
Maintain export volumes
-
Avoid Western shipping restrictions
However, it introduces:
-
Higher transport costs
-
Environmental risks
-
Operational inefficiencies
Russian Oil Suppliers Database
Russia’s oil supply chain is concentrated among a few dominant players.
Rosneft
-
Largest oil producer in Russia
-
Accounts for 40% of total output
-
Major exporter to India and China
Lukoil
-
Second-largest private oil company
-
Strong refining and international trading network
Gazprom Neft
-
Oil arm of Gazprom
-
Increasing role in Asian exports
Surgutneftegas
-
Large but less transparent
-
Significant export volumes
Midstream & Trading Layer
Russia’s oil trade relies on a complex network of intermediaries.
Types of Entities
-
State-controlled trading arms
-
Independent commodity traders
-
Offshore shell companies
Functions
-
Cargo routing
-
Payment processing
-
Sanctions avoidance
Downstream & Buyers
Key Buyers
-
Indian refiners (Reliance, Nayara)
-
Chinese state-owned companies
-
Turkish refiners
These entities form the backbone of Russia’s export demand.
Pricing Dynamics and Discounts
Russia’s oil pricing strategy is central to maintaining exports.
Urals Crude Pricing
-
Discount to Brent: $8–15 per barrel
-
Occasionally exceeds $20 in high-risk periods
Drivers of Discounts
-
Sanctions risk
-
Limited buyer pool
-
Longer shipping routes
-
Insurance constraints
Net Effect
-
Lower revenue per barrel
-
Sustained demand
Monthly Export Trends in 2025
Russia’s exports show moderate volatility throughout the year.
Q1 2025
-
Strong exports due to winter demand
-
Higher prices
Q2 2025
-
Slight production cuts
-
Stable export volumes
Q3 2025
-
Increased shadow fleet usage
-
Declining revenues
Q4 2025
-
Revenue drops to its lowest levels since 2022
-
China dominates demand
Shipping and Cost Structure
Sanctions have increased the cost of exporting Russian oil.
Cost Increases
-
Shipping costs: +30–50%
-
Insurance premiums: significantly higher
-
Longer routes to Asia
Example
-
Baltic to Europe: 7 days (pre-2022)
-
Baltic to India: 30–40 days (2025)
Result
-
Reduced profit margins
-
Increased reliance on high-volume exports
Risks and Constraints
Russia’s oil sector faces multiple risks.
1. Sanctions Escalation
Further restrictions could target:
-
Shadow fleet
-
Financial transactions
2. Infrastructure Attacks
-
Increasing drone strikes on refineries and ports
3. Market Concentration
-
Overdependence on China and India
4. Aging Infrastructure
-
Pipelines and tankers require upgrades
Strategic Outlook
Russia’s oil export model is evolving, not shrinking.
Key Trends for 2026+
-
Continued pivot to Asia
-
Expansion of non-Western shipping networks
-
Gradual narrowing of discounts if markets stabilize
Long-Term Outlook
Russia will remain a major oil exporter due to:
-
Large reserves
-
Established infrastructure
-
Strong demand from Asia
February 2026 Update: Latest Data on Russian Oil Exports and Sanctions Impact
The latest available data from February 2026 provides important insight into how Russia’s oil export system is performing under continued sanctions pressure. While overall export volumes remain relatively stable, revenue trends and logistics patterns highlight increasing strain.
Export Revenue Trends (February 2026)
-
Total fossil fuel export revenue: €640–680 million per day
-
Oil (crude + products) share: 70–75% of total revenue
-
Year-on-year change: Continued decline compared to 2024 levels
Despite stable shipment volumes, revenue remains under pressure due to:
-
Persistent price discounts
-
Enforcement of price caps
-
Increased transportation costs
Key Insight: Russia is maintaining export flows, but earning less per unit, reinforcing the shift toward a volume-driven model.
Crude Oil Export Volumes
-
Seaborne crude exports: 3.3–3.5 million barrels per day
-
Total crude + products exports: 7–7.5 million barrels per day
Export volumes have not collapsed, indicating:
-
Strong demand from Asian markets
-
Effective rerouting of cargoes
Export Destinations (February 2026)
Regional Distribution
-
China: Largest buyer, consistent demand
-
India: Second-largest importer, strong refining demand
-
Turkey: Key secondary hub for refined products
Combined, China and India continue to account for 75–80% of Russian crude exports.
Key Insight: Russia’s dependence on a small group of buyers has increased further, making its export system more concentrated than ever.
Price Cap Compliance and Evasion
The February 2026 data highlights ongoing challenges in enforcing the G7 price cap.
-
A significant share of Russian oil is still sold above the $60/barrel cap
-
Use of non-Western insurers and financial channels remains widespread
Sanctions Impact Assessment
The February 2026 Russia oil export report suggests that sanctions are working only partially and in limited ways.
What Sanctions Have Achieved
-
Reduced Russian oil revenues
-
Increased operational costs
-
Limited access to Western services
What Sanctions Have Not Achieved
-
Significant reduction in export volumes
-
Complete enforcement of price caps
Overall Takeaways from February 2026 Data
-
Export volumes remain resilient
-
Revenues continue to decline gradually
-
Asia remains the dominant market
-
The shadow fleet is critical infrastructure
-
Sanctions are impacting margins, not volumes
Conclusion and Final Thoughts
In conclusion, Russia’s oil exports in 2025 demonstrate resilience under pressure, but also reveal a fundamental shift in how the country operates in global energy markets.
Summary
-
Production stable at 9–10 million bpd
-
Exports steady at 238 million tons
-
Asia dominates with 80% share
-
Revenues are declining due to discounts
-
The shadow fleet plays a critical role
The key takeaway is simple: Russia has not lost its ability to export oil. It has rewired its entire export system to survive under sanctions. That system is more complex, less efficient, & more dependent on a narrow set of partners, but it works. For analysts and businesses, the Russian oil market in 2025 is no longer about volume risk. It is about pricing power, export control, and geopolitical alignment.
Note For Our Readers
We hope this blog gives you a clearer, data-driven understanding of how Russia’s oil export system has evolved in 2025, from stable production levels to shifting trade routes, pricing pressures, and the growing reliance on Asian markets. As global energy dynamics continue to change, driven by sanctions, trade challenges, and geopolitical realignments, having access to accurate and granular Russia import-export data is more critical than ever.
If you’re looking to go beyond high-level insights and need deeper, data-backed intelligence, TradeImeX can support your requirements. We provide detailed Russia oil export data by country, company, and HS codes, along with real-time updates that reflect ongoing market shifts. Whether you are identifying reliable suppliers, tracking export flows, or analyzing pricing and demand trends, our customized datasets and analytics tools can help you make more informed and strategic decisions. Contact info@tradeimex.in today to skyrocket your business.
Read also about:
Share
What's Your Reaction?
 Like
2
Like
2
 Dislike
1
Dislike
1
 Love
1
Love
1
 Funny
1
Funny
1
 Angry
1
Angry
1
 Sad
1
Sad
1
 Wow
1
Wow
1