ASEAN–EU Trade Relations 2026: Can Europe Become ASEAN’s Next Big Growth Trade Partner?
Explore ASEAN-EU trade relations 2026 with insights on EU-ASEAN trade flows, Asia-Europe trade trends, & the latest Europe & Asia trade data.
Global trade is shifting. Supply chains are being redrawn, geopolitical tensions are reshaping alliances, and countries are actively diversifying away from overdependence on any single partner. In this context, the relationship between ASEAN (Association of Southeast Asian Nations) and the European Union (EU) is gaining new attention. According to the latest Europe trade data and Asia trade data, the total value of ASEAN imports from the EU reached $108.23 billion in 2025, while ASEAN exports to the EU accounted for $127.13 billion in 2025. The total EU-ASEAN trade value accounted for $235.36 billion in 2025.
The key question for 2026 is simple but important: Can Europe realistically become ASEAN’s next major growth trade partner? The answer is not straightforward. The data shows strong momentum, but also clear structural limits. This blog breaks it down using recent trade figures, policy trends, and economic realities of the Asia-Europe trade.
Starting Point: Large but Underleveraged Trade Relationship
The Association of Southeast Asian Nations (ASEAN) and the European Union (EU) already have a significant trade relationship. However, it often gets overshadowed by ASEAN’s ties with China and the United States.
-
In 2025, EU–ASEAN trade in goods reached $235.3 billion
-
Total two-way trade is estimated at $292.8 billion in 2026
-
Trade in services added another €132.1 billion in 2025
That puts the EU among ASEAN’s top trading partners, though not the dominant one.
From ASEAN’s perspective:
-
The EU accounts for about 8.5% of ASEAN’s global exports
From Europe’s perspective:
-
ASEAN is the EU’s 5th largest trading partner
This is a sizable relationship, but it’s still secondary compared to other trade corridors.
What Changed: The Strategic Reset in ASEAN–EU Relations
The 25th ASEAN–EU Ministerial Meeting (2025) marks an important shift. It signals that both sides are no longer treating the relationship as secondary.
Key Takeaways from the Ministerial Statement
1. Commitment to a Strategic Partnership
Both sides reaffirmed their intention to deepen ties beyond trade:
-
Economic cooperation
-
Digital transformation
-
Green transition
-
Security collaboration
This matters because trade growth rarely happens in isolation. It follows political alignment.
2. Renewed Push Toward Trade Agreements
The statement emphasized:
-
Accelerating bilateral free trade agreements
-
Keeping the long-term goal of an ASEAN–EU region-to-region FTA
This is critical. Without trade agreements, growth will hit a ceiling.
3. Focus on Supply Chain Resilience
Both ASEAN and the EU highlighted:
-
Diversifying supply chains
-
Reducing dependency on single-country sourcing
-
Strengthening regional manufacturing networks
This aligns directly with Europe’s need to reduce reliance on China and ASEAN’s goal to move up the value chain.
4. Digital and Green Economy Cooperation
The statement strongly emphasized:
-
Digital trade frameworks
-
Data governance cooperation
-
Renewable energy partnerships
-
Sustainable infrastructure
These are not side issues. They represent the next phase of trade growth.
ASEAN’s Trade Gravity: Why Europe Isn’t the Top Partner
To understand whether Europe can rise further, you need to understand ASEAN’s current trade structure. Among the EU members, Germany is the largest trade partner of ASEAN, as per the Germany trade data, while Vietnam is the largest trading partner of the EU among the ASEAN members, according to Vietnam trade data.
ASEAN’s Trade Scale
-
Total ASEAN trade in goods reached $3.8 trillion in 2025.
-
Exports alone are around $2 trillion annually, according to the data on the top ASEAN exports.
Major Partners
ASEAN’s exports are heavily concentrated:
-
United States: 16%
-
China: 15%
Compare that to:
-
EU: 8–9%
Why Asia Still Dominates
Three reasons explain this imbalance:
1. Geographic proximity: Shorter shipping times and lower logistics costs favor intra-Asian trade.
2. Integrated supply chains: ASEAN is deeply embedded in regional manufacturing networks, especially with China, Japan, and South Korea.
3. Trade agreements: Frameworks like RCEP (Regional Comprehensive Economic Partnership) make intra-Asian trade easier than EU-ASEAN trade.
In short, Europe starts at a disadvantage.
Top Goods ASEAN Imports from the EU: What ASEAN Imports from the EU?
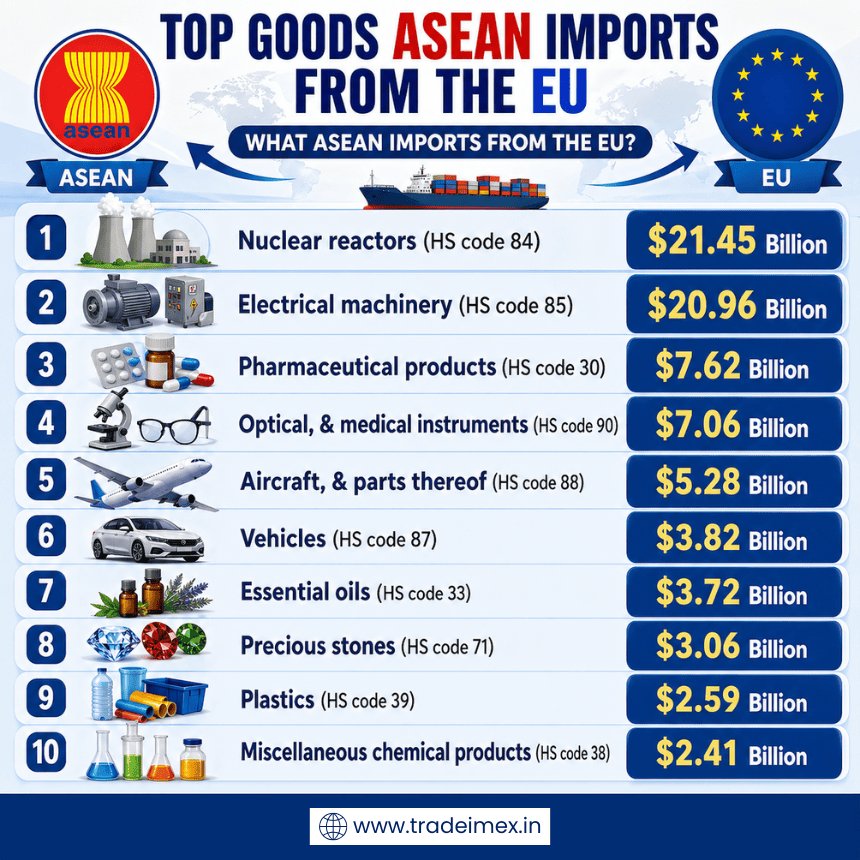
The top goods that the Association of Southeast Asian Nations (ASEAN) imports from the European Union (EU) include sophisticated machinery, high-tech equipment, automobiles, pharmaceuticals, and chemicals. These imports contribute significantly to the growth of ASEAN economies by satisfying the region's demand for advanced technology and high-quality goods. The top 10 products imported by the ASEAN bloc from the EU in 2025 include:
1. Nuclear reactors & machinery (HS code 84): $21.45 billion
Nuclear reactors and machinery are among the top goods imported by ASEAN countries from the EU, with a total value of $21.45 billion. This includes machinery for the production of energy, as well as equipment used in various industrial processes.
2. Electrical machinery & equipment (HS code 85): $20.96 billion
Electrical machinery and equipment are also high on the list of goods imported by ASEAN from the EU, with a total value of $20.96 billion. This category includes items such as computers, telecommunications equipment, and other electronic devices.
3. Pharmaceutical products (HS code 30): $7.62 billion
Pharmaceutical products hold a significant share of ASEAN imports from the EU, amounting to $7.62 billion. This includes a wide range of medications, vaccines, & medical supplies.
4. Optical, medical, & surgical instruments (HS code 90): $7.06 billion
Optical, medical, and surgical instruments are also key goods imported by ASEAN from the EU, with a total value of $7.06 billion. These instruments play a crucial role in healthcare and medical treatments.
5. Aircraft, spacecraft, & parts thereof (HS code 88): $5.28 billion
The aerospace industry is another important sector for ASEAN imports from the EU, with aircraft, spacecraft, and related parts totaling $5.28 billion. This includes airplanes, helicopters, and components for the aviation sector.
6. Vehicles (HS code 87): $3.82 billion
Vehicles are a popular import category for ASEAN countries from the EU, with a total value of $3.82 billion. This includes cars, trucks, buses, and other modes of transportation.
7. Essential oils, perfumery, & cosmetics (HS code 33): $3.72 billion
Essential oils, perfumery, and cosmetics are also in demand in ASEAN, with imports from the EU valued at $3.72 billion. This includes a wide range of beauty and personal care products.
8. Precious stones & metals (HS code 71): $3.06 billion
Precious stones and metals are among the top goods imported by ASEAN from the EU, with a total value of $3.06 billion. This includes diamonds, gold, silver, and other valuable gemstones.
9. Plastics & articles thereof (HS code 39): $2.59 billion
Plastics and articles thereof are also significant imports for ASEAN from the EU, amounting to $2.59 billion. This category includes a wide range of plastic products used in various industries.
10. Miscellaneous chemical products (HS code 38): $2.41 billion
Lastly, miscellaneous chemical products are key goods imported by ASEAN from the EU, with a total value of $2.41 billion. This includes a variety of chemical compounds and substances used in different applications.
Top Goods ASEAN Exports to the EU: What Does ASEAN Export to the EU?
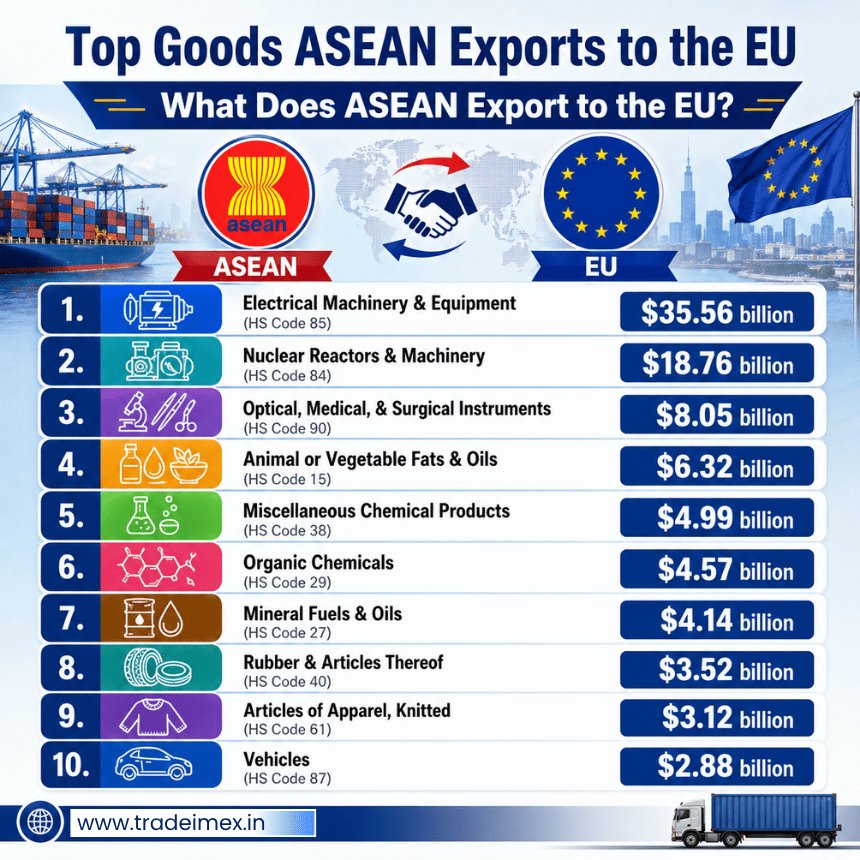
The main goods that the Association of Southeast Asian Nations (ASEAN) exports to the European Union (EU) include a diverse range of products, from electrical machinery and equipment to clothing and footwear. In recent years, ASEAN countries have notably increased their exports of machinery, electronic equipment, and vehicles to the EU, demonstrating the region's strength in manufacturing and trade. The major goods that ASEAN exports to the EU, as per the EU-ASEAN trade data for 2025, include:
1. Electrical Machinery & Equipment (HS Code 85): $35.56 billion
Topping the list of ASEAN exports to the EU is electrical machinery and equipment, which accounted for a staggering $35.56 billion in trade value. This category includes a wide range of products such as electrical motors, generators, and electrical signaling devices. ASEAN countries have established themselves as major players in the global electrical machinery market, with high-quality products that meet international standards.
2. Nuclear Reactors & Machinery (HS Code 84): $18.76 billion
The export of nuclear reactors and machinery is another significant source of revenue for ASEAN countries, with a trade value of $18.76 billion. This category includes equipment such as boilers, machinery parts, and turbo-jets. As the demand for energy continues to rise, nuclear reactors and machinery play a crucial role in meeting the energy needs of the EU market.
3. Optical, Medical, & Surgical Instruments (HS Code 90): $8.05 billion
Optical, medical, and surgical instruments are essential goods that ASEAN countries export to the EU, with a trade value of $8.05 billion. This category includes products like spectacles, lenses, and medical devices. ASEAN countries are known for their expertise in producing high-quality optical and medical equipment, making them valuable trading partners for the EU.
4. Animal or Vegetable Fats & Oils (HS Code 15): $6.32 billion
The export of animal or vegetable fats and oils is another key sector for ASEAN countries, with a trade value of $6.32 billion. This category includes products like palm oil, coconut oil, and animal fats. ASEAN countries are major producers of fats and oils, supplying the EU market with essential ingredients for various industries.
5. Miscellaneous Chemical Products (HS Code 38): $4.99 billion
Miscellaneous chemical products are also significant exports from ASEAN countries to the EU, with a trade value of $4.99 billion. This category includes a wide range of chemical products such as dyes, pigments, and chemical preparations. ASEAN countries have a strong chemical industry, producing high-quality products that meet the diverse needs of the EU market.
6. Organic Chemicals (HS Code 29): $4.57 billion
Organic chemicals are another valuable export category for ASEAN countries, with a trade value of $4.57 billion. This category includes products like organic compounds, acids, and alcohols. ASEAN countries are known for their expertise in producing organic chemicals, catering to the demand for these products in the EU market.
7. Mineral Fuels & Oils (HS Code 27): $4.14 billion
The export of mineral fuels and oils is a significant sector for ASEAN countries, with a trade value of $4.14 billion. This category includes products like petroleum oils, coal, and natural gas. ASEAN countries are rich in natural resources, making them key suppliers of mineral fuels and oils to the EU market.
8. Rubber & Articles Thereof (HS Code 40): $3.52 billion
Rubber and articles thereof are essential exports from ASEAN countries to the EU, with a trade value of $3.52 billion. This category includes products like rubber tires, tubes, and belts. ASEAN countries are major producers of rubber products, supplying the EU market with high-quality rubber goods.
9. Articles of Apparel, Knitted (HS Code 61): $3.12 billion
The export of articles of apparel, knitted, is another significant sector for ASEAN countries, with a trade value of $3.12 billion. This category includes products like knitted clothing, accessories, and garments. ASEAN countries have a thriving textile and garment industry, producing fashionable and high-quality apparel for the EU market.
10. Vehicles (HS Code 87): $2.88 billion
Lastly, vehicles are important exports from ASEAN countries to the EU, with a trade value of $2.88 billion. This category includes products like cars, motorcycles, and parts. ASEAN countries have a growing automotive industry, producing vehicles that meet the stringent requirements of the EU market.
EU-ASEAN Trade Data in the Last 10 Years

|
Year of Trade |
ASEAN-EU Total Trade ($) |
|
2015 |
$201.32 billion |
|
2016 |
$205.71 billion |
|
2017 |
$230.39 billion |
|
2018 |
$257.52 billion |
|
2019 |
$245.28 billion |
|
2020 |
$226.03 billion |
|
2021 |
$269.19 billion |
|
2022 |
$295.40 billion |
|
2023 |
$280.11 billion |
|
2024 |
$291.15 billion |
|
2025 |
$235.36 billion |

Growth Momentum: The Case for Europe
Despite these structural barriers, the trajectory of EU–ASEAN trade is clearly upward.
Strong Historical Growth
-
Trade in goods has grown nearly 67% over the past decade
-
Services trade has surged 146% between 2013–2023
Investment Strength
-
EU foreign direct investment (FDI) into ASEAN reached $20 billion in 2024
-
Total FDI stock from the EU in ASEAN is over €370 billion
This matters because investment often leads to trade. European companies build factories, integrate supply chains, and increase exports and imports over time.
ASEAN’s Growth Engine
ASEAN itself is expanding rapidly:
-
GDP: $4 trillion
-
Growth rate: 4.7% in 2025
-
FDI inflows: $226 billion in 2025
This makes ASEAN one of the most attractive regions globally for trade expansion.
Strategic Shift: Why Europe Needs ASEAN More Than Before
The geopolitical backdrop is critical.
China Risk and Supply Chain Diversification
Europe is increasingly wary of overdependence on China.
Recent data shows:
-
China ran an $83 billion trade surplus with the EU in early 2026
This imbalance highlights:
-
Europe’s dependence on Chinese manufacturing
-
The need to diversify supply chains
ASEAN is a natural alternative.
US Trade Uncertainty
Global trade tensions, including tariffs, are slowing trade growth:
-
WTO forecasts just 0.5% global trade growth in 2026
This pushes Europe to:
-
Build stable, rules-based partnerships
-
Reduce reliance on volatile markets
ASEAN fits that strategy.
Trade Agreements: The Missing Piece
One of the biggest constraints on EU–ASEAN trade is the lack of a comprehensive free trade agreement (FTA).
Current Situation
The EU has bilateral deals with:
-
Singapore
-
Vietnam
Negotiations are ongoing with:
-
Indonesia
-
Thailand
-
Malaysia
-
Philippines
Why This Matters
Without a region-wide FTA:
-
Tariffs remain uneven
-
Regulatory barriers persist
-
Supply chains are less efficient
Compare this with Asia:
-
RCEP provides a unified trade framework
-
China-ASEAN FTA is being upgraded
Europe is playing catch-up.
Sector-Level Opportunities
To assess future growth, you need to look at what is actually being traded.
ASEAN Exports to the EU
Key sectors include:
-
Electronics (largest category, 29%)
-
Machinery
-
Textiles
-
Agricultural products
EU Exports to ASEAN
Europe exports:
-
Pharmaceuticals
-
Machinery
-
Transport equipment
-
Luxury goods
Emerging Growth Areas
1. Green Technology
-
Renewable energy systems
-
Electric mobility
2. Digital Economy
-
Semiconductors
-
Data infrastructure
3. Healthcare
-
Medical devices
-
Biotech
These sectors align well with both regions’ strengths.
Key Constraints Holding Europe Back
Even with strong momentum, several challenges remain.
1. Regulatory Complexity
ASEAN is not a single market like the EU:
-
Different rules across 10 countries
-
Varying levels of development
2. Shipment and Distance
Shipping between Europe and Southeast Asia is:
-
Slower
-
More expensive
Compared to intra-Asia trade.
3. Competition from China
China remains ASEAN’s largest trading partner:
-
Deep supply chain integration
-
Aggressive trade agreements
4. Limited Political Cohesion
ASEAN’s diversity makes:
-
Negotiations slower
-
Policy alignment harder
The Strategic Opportunity: A “Middle Ground” Partnership
Despite these challenges, EU–ASEAN trade has a unique advantage. It is not just about volume. It is about positioning.
Complementary Strengths
ASEAN offers:
-
Manufacturing capacity
-
Young workforce
-
Fast-growing markets
The EU offers:
-
Advanced technology
-
Capital
-
Regulatory expertise
This creates a complementary, not a competitive relationship.
Scenarios for 2030: Can Europe Become ASEAN’s #2 Partner?
Let’s break it down into realistic scenarios.
Scenario 1: Status Quo
-
Trade continues growing at the current pace
-
EU remains a top-5 partner
Scenario 2: Moderate Integration (Most Likely)
-
More bilateral FTAs finalized
-
Trade surpasses $350-400 billion
-
EU strengthens position as a key partner
Scenario 3: Deep Integration (Optimistic)
-
ASEAN–EU region-wide FTA
-
Major supply chain shifts from China
-
EU becomes ASEAN’s #2 trading partner
This scenario depends heavily on:
-
Political will
-
Trade agreements
-
Global geopolitical shifts
Final Verdict: Can Europe Become ASEAN’s Next Big Growth Partner?
Short answer: Yes, but not automatically.
Why It’s Possible
-
Strong trade growth (+67% over a decade)
-
Rising geopolitical alignment
-
Complementary economies
-
Increasing EU investment
Why It’s Not Guaranteed
-
Strong competition from China and the US
-
Lack of a unified trade agreement
-
Structural and geographic barriers
Conclusion and Final Thoughts
In conclusion, the ASEAN–EU trade relations in 2026 sit at an inflection point. The foundation is already strong:
-
Nearly $300 billion in trade
-
Rapid growth in services and investment
-
Increasing strategic alignment
But the next phase depends on execution.
If the EU can:
-
Accelerate trade agreements
-
Invest deeper in ASEAN supply chains
-
Position itself as a stable alternative to China
Then Europe has a real shot at becoming ASEAN’s next major growth partner. If not, it will remain important but secondary. The opportunity is there. The question is whether Europe moves fast enough to seize it.
Note for Our Readers
We hope this blog has given you a clear, data-driven understanding of ASEAN–EU trade relations in 2026, from the current scale of trade and investment flows to the structural challenges, policy developments, and emerging opportunities shaping this partnership. As global trade continues to evolve amid supply chain realignments, geopolitical shifts, and the push for digital and green transformation, the growing engagement between ASEAN and Europe is becoming increasingly important for businesses, policymakers, and analysts alike.
If you’re looking to move beyond high-level insights and need deeper, actionable trade intelligence & global trade data, TradeImeX can support your business decisions. With access to live import-export data by country, HS code-level analysis, & real-time shipment records, you can better understand ASEAN–EU trade dynamics and identify emerging opportunities. Reach out to us at info@tradeimex.in to strengthen your strategy in today’s shifting global trade landscape.
Share
What's Your Reaction?
 Like
0
Like
0
 Dislike
0
Dislike
0
 Love
0
Love
0
 Funny
1
Funny
1
 Angry
1
Angry
1
 Sad
0
Sad
0
 Wow
0
Wow
0