Malaysia Plastic Waste Scrap Import Data Under HS Code 3915: Trade Statistics 2025
Get Malaysia plastic waste scrap import statistics for 2025 under HS Code 3915. View supplier countries, volumes, values, and trade insights.

The plastic waste trade has become one of the most closely watched segments of global commodities over the last decade. Environmental pressure, regulatory tightening, and shifting recycling economics have transformed what was once a low-profile trade flow into a politically sensitive and highly regulated industry. Malaysia stands at the center of this transformation. According to the latest Malaysia import data and Malaysia customs import data of plastic waste, the total value of Malaysia plastic waste scrap imports reached $168.15 million in 2024, a 3% decline from the previous year. According to the Malaysia plastic waste scrap import data under HS code 3915, Malaysia imported plastic waste & scrap worth $153.46 million in the first three quarters of 2025.
Malaysia is the 6th largest plastic waste scrap importer in the world, as per the global trade data and Malaysia customs data. This article presents a deep, data-driven analysis of Malaysia’s plastic waste scrap imports under HS Code 3915, focusing on trade statistics, partner country trends, product segmentation, policy impacts, and market outlook for 2024 and 2025.
Understanding HS Code 3915 in Global Trade
HS Code 3915 covers:
-
Waste, parings, and scraps of plastics
-
Post-consumer plastic waste
-
Industrial plastic scrap
-
Sorted and unsorted plastic materials intended for recycling or reprocessing
This code does not include finished plastic products or virgin polymers. Instead, it captures the flow of discarded plastics that move across borders for recovery, recycling, or secondary manufacturing.
Sub-categories within HS 3915 typically include:
-
391510 – Waste and scrap of polyethylene
-
391520 – Waste and scrap of polystyrene
-
391530 – Waste and scrap of PVC
-
391590 – Waste and scrap of other plastics or mixed plastics
These distinctions are important because import value, contamination risk, and regulatory treatment vary significantly by polymer type.
Malaysia’s Strategic Role in Plastic Scrap Trade
Why Malaysia Became a Major Importer
Malaysia emerged as a major plastic scrap importer after global waste trade patterns shifted in the late 2010s. As traditional destinations restricted imports, Southeast Asia absorbed a growing share of global plastic waste flows. In 2025, Malaysia also enforced restrictions on plastic waste imports.
Malaysia offered:
-
Established plastics manufacturing and recycling capacity
-
Competitive processing costs
-
Strategic port infrastructure
-
Proximity to major exporting regions
By the early 2020s, Malaysia ranked among the top plastic waste importing countries globally, both by volume and shipment count.
Malaysia Plastic Waste Scrap Imports by Country: Where Does Malaysia Import Plastic Waste From?

Malaysia's plastic waste scrap imports under HS code 3915 come from various countries, reflecting the global nature of the plastic waste trade. Countries such as the United States, Japan, Singapore, and the United Kingdom are among the key sources of plastic waste imported by Malaysia. These imports play a significant role in Malaysia's recycling industry, providing raw materials for local plastic manufacturers. The top 10 countries from which Malaysia imports plastic waste & scrap, as per Malaysia shipment data for 2025, include:
1. USA: $43.19 million (25.7%)
The United States is the largest exporter of plastic waste to Malaysia. With a total value of $43.19 million, the USA accounts for 25.7% of Malaysia's plastic waste imports. American companies have been sending large quantities of plastic scrap to Malaysia to meet the growing demand for recycled plastics in the country.
2. Germany: $21 million (12.5%)
Germany is another significant contributor to Malaysia's plastic waste imports. With an export value of $21 million, Germany holds a 12.5% share of Malaysia's plastic waste imports, as per the data on Germany plastic waste & scrap exports to Malaysia. German companies have been actively participating in the global plastic waste trade, with Malaysia being one of their major destinations.
3. Belgium: $15.50 million (9.2%)
Belgium is also a key player in the plastic waste trade with Malaysia. With an export value of $15.50 million, Belgium contributes 9.2% to Malaysia's plastic waste imports. Belgian companies have been sending plastic scrap to Malaysia as part of their recycling efforts and to meet the demand for recycled plastics in the country.
4. Japan: $13.53 million (8%)
Japan is a significant exporter of plastic waste to Malaysia, with an export value of $13.53 million, as per the data on Japan plastic waste exports to Malaysia by HS code. Accounting for 8% of Malaysia's plastic waste imports, Japanese companies have been actively participating in the global plastic waste trade and supplying recycled plastics to Malaysia.
5. Spain: $12.56 million (7.5%)
Spain is another country that plays a significant role in Malaysia's plastic waste imports. With a total export value of $12.56 million, Spain holds a 7.5% share of Malaysia's plastic waste imports. Spanish companies have been sending plastic scrap to Malaysia to support the country's recycling industry.
6. United Kingdom: $10.78 million (6.4%)
The United Kingdom is also a major exporter of plastic waste to Malaysia. With an export value of $10.78 million, the UK accounts for 6.4% of Malaysia's plastic waste imports. British companies have been actively participating in the global plastic waste trade and supplying recycled plastics to Malaysia.
7. Netherlands: $8.94 million (5.3%)
The Netherlands is a key player in the global plastic waste trade, with an export value of $8.94 million to Malaysia. Contributing 5.3% to Malaysia's plastic waste imports, Dutch companies have been sending plastic scrap to Malaysia as part of their recycling efforts.
8. Canada: $8.24 million (4.9%)
Canada is also a significant contributor to Malaysia's plastic waste imports, with an export value of $8.24 million. Accounting for 4.9% of Malaysia's plastic waste imports, Canadian companies have been actively participating in the global plastic waste trade and supplying recycled plastics to Malaysia.
9. Slovenia: $6.86 million (4.1%)
Slovenia is a lesser-known contributor to Malaysia's plastic waste imports, with an export value of $6.86 million. Despite being a smaller player in the global plastic waste trade, Slovenian companies have been sending plastic scrap to Malaysia to support the country's recycling industry.
10. Singapore: $6.46 million (3.8%)
Singapore is also a significant exporter of plastic waste to Malaysia. With an export value of $6.46 million, Singapore contributes 3.8% to Malaysia's plastic waste imports. Singaporean companies have been actively participating in the global plastic waste trade and supplying recycled plastics to Malaysia.
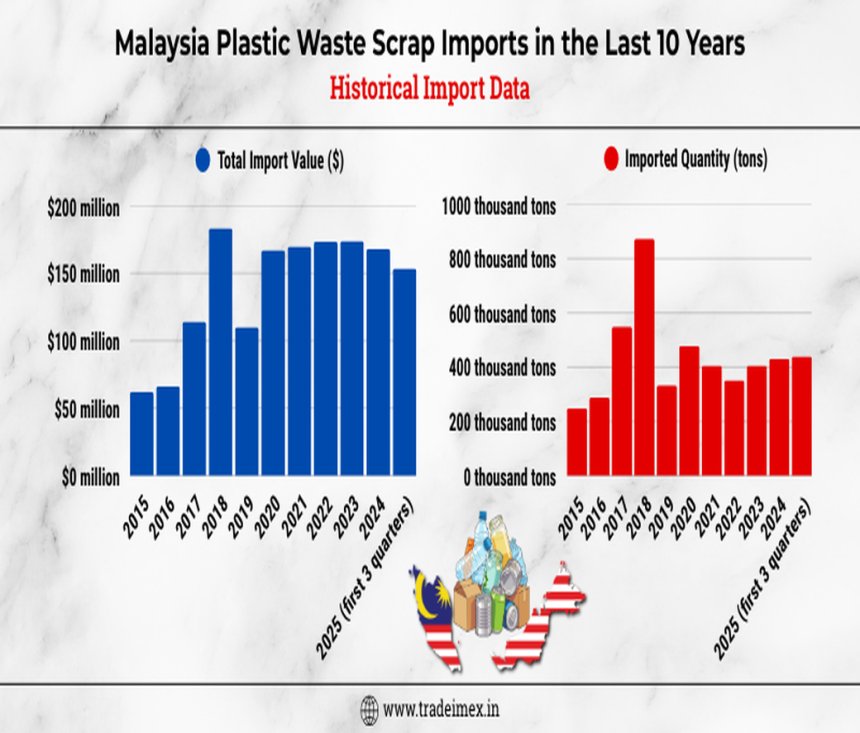
Malaysia Plastic Waste Scrap Imports in the Last 10 Years: Historical Import Data
|
Year of Imports |
Total Import Value ($) |
Imported Quantity (tons) |
|
2015 |
$62.25 million |
248.50 thousand tons |
|
2016 |
$66.26 million |
287.67 thousand tons |
|
2017 |
$114.24 million |
549.78 thousand tons |
|
2018 |
$183.45 million |
872.76 thousand tons |
|
2019 |
$110.13 million |
333.50 thousand tons |
|
2020 |
$167.30 million |
478.09 thousand tons |
|
2021 |
$169.77 million |
405.01 thousand tons |
|
2022 |
$173.55 million |
351.28 thousand tons |
|
2023 |
$174.14 million |
405.86 thousand tons |
|
2024 |
$168.15 million |
431.50 thousand tons |
|
2025 (first 3 quarters) |
$153.46 million |
439.46 thousand tons |
Baseline Trade Performance
To understand the import performance in 2025, it is essential to establish a baseline.
Import Volume
In the first 3 quarters of 2025, Malaysia imported over 439,000 metric tons of plastic waste and scrap under HS Code 3915. This volume placed Malaysia firmly among the top global importers.
Import Value
The import value exceeded USD 153 million, reflecting not only high volumes but also a growing share of cleaner, higher-value plastic scrap suitable for recycling.
Share in Total Imports
Despite its visibility, HS 3915 represented less than 0.1% of Malaysia’s total import value, showing that plastic waste is economically niche but environmentally and politically significant.
Historical Supplier Structure
Malaysia’s plastic waste imports have historically come from developed economies with mature consumption markets and recycling surpluses. These regions supplied plastic waste primarily from post-consumer packaging, commercial waste streams, and industrial scrap.
Key supplier regions include:
-
North America
-
Western Europe
-
East Asia
-
Oceania
Malaysia’s Product-Level Breakdown Under HS Code 3915
Dominant Plastic Types
Analysis of customs data shows the following structure:
-
Polyethylene waste (PE) accounted for roughly 60–65% of the import value
-
Mixed plastic scrap represented about 30–35%
-
PVC, polystyrene, and other plastics made up the remaining share
This distribution matters because polyethylene waste is easier to recycle and commands better prices, while mixed plastics face stricter scrutiny and lower margins.
Shift Toward Cleaner Scrap
Between 2022 and 2024, Malaysia’s import mix gradually shifted toward better-sorted and cleaner plastic waste, reflecting tighter inspection regimes and industry demand for higher processing efficiency.
Shipment-Level Insights and Trade Intensity
Shipment Counts
While volume and value show scale, shipment counts reveal trade intensity.
In late 2024 and throughout 2025:
-
Malaysia received thousands of HS 3915 shipments annually
-
Average shipment size ranged from 20 to 25 metric tons, typical for containerized plastic scrap
-
Imports were heavily concentrated at major ports such as Port Klang and Penang
This shipment density underscores Malaysia’s role as a continuous, high-frequency importer rather than an occasional bulk buyer.
Malaysia Plastic Waste Import Trends in 2025
Volume Trends
Preliminary aggregated data indicate that 2025 import volumes remained strong, with slight growth compared to 2024.
Key characteristics include:
-
Stable to modestly rising tonnage
-
Slight increase in average import price per ton
-
Reduced share of low-quality mixed plastic scrap
Value Trends
The import value in 2025 is estimated to have increased moderately, driven by:
-
Higher quality material
-
Rising global recycling costs
-
Increased compliance and inspection expenses are built into pricing
Regulatory Shifts Shaping 2025 Trade
Basel Convention Alignment
One of the most important developments influencing 2025 trade was Malaysia’s stricter enforcement of Basel Convention-aligned rules on plastic waste imports.
Key regulatory features include:
-
Mandatory pre-approval for plastic waste imports
-
Import eligibility is limited to countries compliant with international waste trade agreements
-
Enhanced documentation and traceability requirements
Impact on Exporting Countries
These rules significantly altered Malaysia’s supplier mix:
-
Exports from non-compliant countries faced major restrictions
-
Long-standing trade flows were disrupted
-
Some exporters exited the Malaysian market entirely
This regulatory tightening is expected to have a visible impact on 2025 import volumes, particularly from traditional suppliers.
Quality Controls and Contamination Standards
Another defining feature of the 2025 trade is stricter contamination thresholds and plastic waste controls.
Malaysia now enforces:
-
Lower allowable non-plastic contamination
-
Stricter limits on hazardous or mixed materials
-
Pre-shipment inspection and certification
As a result:
-
Lower-quality mixed scrap shipments declined
-
Cleaner, single-polymer scrap gained market share
-
Average import prices increased
Economic Implications for Malaysia
Benefits to the Domestic Industry
Plastic scrap imports continue to support:
-
Recycling plants
-
Secondary plastic manufacturing
-
Export-oriented plastic product industries
Imported scrap provides feedstock that domestic waste streams alone cannot fully supply.
Environmental and Compliance Costs
At the same time, Malaysia bears:
-
Inspection and enforcement costs
-
Waste management risks
-
Pressure on local recycling infrastructure
These factors have pushed policymakers to prioritize quality over volume.
2026 Trade Outlook
Expected Volume Adjustment
For 2025, analysts expect:
-
Lower or stabilized total import volume
-
Reduced shipment counts
-
Higher average import value per ton
This reflects a shift from quantity-driven trade to quality-driven trade.
Supplier Realignment
Trade is likely to concentrate among:
-
European exporters
-
Japan and select Asia-Pacific countries
-
Suppliers can meet stricter certification standards
Long-Term Structural Trends
Malaysia’s plastic waste import market is no longer defined by unchecked growth. Instead, it is shaped by:
-
Regulatory compliance
-
Environmental accountability
-
Market consolidation
-
Higher barriers to entry
This aligns Malaysia more closely with global sustainability frameworks while preserving its role as a regional recycling hub.
Key Takeaways
-
Malaysia remains one of the world’s major importers of plastic waste under HS Code 3915
-
Import volumes in 2024 remained strong, with stable to rising values
-
2025 marks a structural shift driven by stricter regulations and Basel Convention alignment
-
Trade is moving toward cleaner, higher-value plastic scrap
-
Supplier countries and shipment patterns are becoming more selective
-
Malaysia’s role is evolving from a volume-based importer to a regulated recycling center
Conclusion and Final Thoughts
In conclusion, the trade of plastic waste scrap under HS Code 3915 in Malaysia is undergoing a decisive transformation. While the country continues to play a major role in global recycling supply chains, 2024 & 2025 represent a turning point. What once functioned as a high-volume import market is becoming a regulated, quality-focused trade ecosystem. For exporters, compliance & material quality are now non-negotiable. For Malaysia, the challenge lies in balancing industrial demand with environmental responsibility. As official 2025 trade data continues to emerge, one conclusion is already clear: Malaysia’s plastic waste import market is smaller, stricter, and more structured than ever before, and that trend is likely to continue.
For more insights into the latest Malaysia export-import data, or to search live data on plastic waste imports under HS code 3915 by country, visit TradeImeX. Contact us at info@tradeimex.in for customized trade reports & market insights.
Share
What's Your Reaction?
 Like
0
Like
0
 Dislike
0
Dislike
0
 Love
0
Love
0
 Funny
0
Funny
0
 Angry
0
Angry
0
 Sad
0
Sad
0
 Wow
0
Wow
0