Everything About the Philippines Trade Data: Quarterly Analytical Report
The Philippines is one of the world’s island countries located on the Southeastern Asian continent near the western edge of the Pacific Ocean. Till now, close to 7000 islands are believed to exist in this nation.

SYNOPSIS
The Philippines is one of the world’s island countries located on the Southeastern Asian Continent near the western edge of the Pacific Ocean. Till now, close to 7000 Islands are believed to exist in this nation. To be precise, the Philippines is an archipelago nation situated about 800km from the coast of Vietnam. The largest island in this nation is named Luzon Island on which, the major cities of the Philippines like Manila and Quezon City are present. From the east, the country shares its coastal boundaries with the Philippine Sea; the southern coastal boundaries are shared with the Celebes Sea; the Southeast boundaries with the Sulu Sea, and the north and west coastal boundaries with the South China Sea which is the major trade route of the country.
As per research and experts, the Philippines is home to numerous precious and natural minerals like Gold, Iron, Chromite, Copper, and Lead. Apart from these, other minerals which are found here in lesser quantities are mercury, nickel, and silver. The Philippines is the biggest producer of sugar across the globe.
Moving forward, let’s look at some of the trade insights of the Philippines on an annual basis. According to the Philippines Customs Data report, the previous 5 years’ imports, and exports to and from the nation were as follows:
|
TOTAL IMPORTS AND EXPORTS TO AND FROM THE PHILIPPINES (2018-2022) |
|||
|
YEAR |
IMPORTS |
EXPORTS |
TOTAL TRADE |
|
2018 |
USD 115.11 billion |
USD 67.48 billion |
USD 182.59 billion |
|
2019 |
USD 112.90 billion |
USD 70.33 billion |
USD 338.95 billion |
|
2020 |
USD 90.75 billion |
USD 63.87 billion |
USD 183.23 billion |
|
2021 |
USD 124.38 billion |
USD 74.61 billion |
USD 198.99 billion |
|
2022 |
USD 145.88 billion |
USD 78.92 billion |
USD 224.80 billion |
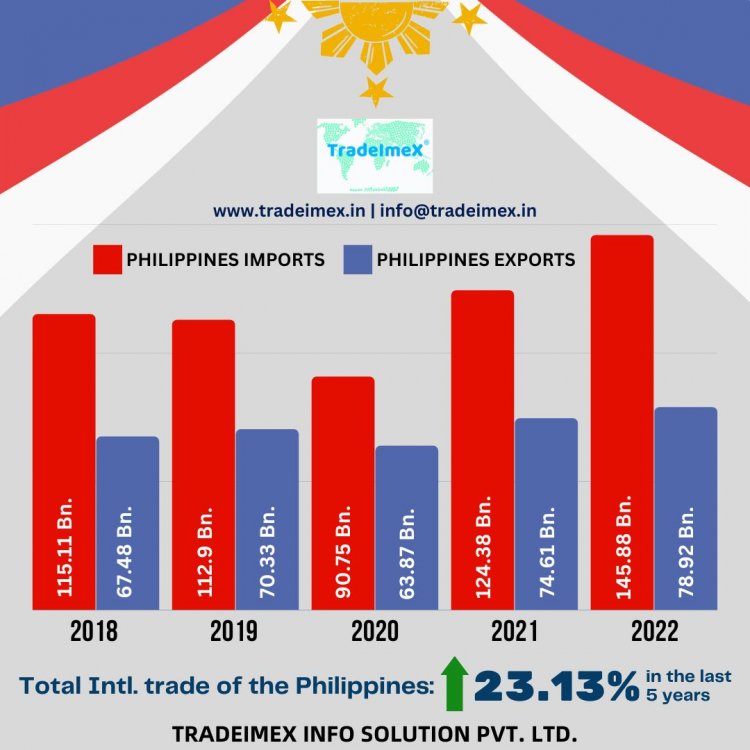
The aggregate of imports and exports to and from the Philippines has gone up by 23.11% in the past 5 annual years. It has been observed that the Philippines is not able to maintain a trade surplus till now as the values registered in the Philippines Import Data are more than the values registered in the Philippines Export Data report.
----------
QUARTERLY TRADE ANALYSIS REPORT (2020-2021)
Let’s see in detail how the trade figures of the Philippines perform on a quarterly basis by taking into consideration the trade values on the quarterly basis for the years 2020 and 2021. This will help you to understand in which quarter the nation performs well and in which quarter the nation’s trade figures decline.
As per the Philippines Trade Data reports, the quarter-wise analysis is as follows:
|
QUARTER-WISE TRADE STATISTICS OF THE PHILIPPINES (USD) |
|||||
|
|
Q1 (2020) |
Q2 (2020) |
Q3 (2020) |
Q4 (2020) |
Q1 (2021) |
|
IMPORTS |
24.68 Bn. |
16.88 Bn. |
24.22 Bn. |
24.96 Bn. |
27.45 Bn. |
|
EXPORTS |
15.73 Bn. |
12.74 Bn. |
17.43 Bn. |
17.96 Bn. |
17.64 Bn. |
|
TOTAL |
40.41 Bn. |
29.62 Bn. |
41.65 Bn. |
42.92 Bn. |
45.09 Bn. |
Based on the trade figures mentioned in the table above, it becomes obvious that the trade increased in Q1 (2021) when compared with the trade done in Q1 (2020) by 11.58%. On comparing the imports and exports separately, as per the Philippines Export Data report, exports of the nation rose by USD 1.91 billion (12.14%). While Imports to the Philippines as per the Philippines Import Data report, were also increased by USD 2.77 billion or 11.22%. From this analysis, it can be easily concluded that the Philippines increased both, its imports, as well as exports too in Q1 of 2021.
----------
TOP 10 EXPORT PRODUCTS OF THE PHILIPPINES
Based on the insights derived from the Philippines Trade Data statistics for the 1st quarter of both years, top exports from the nation to the world were as follows:
QUARTER 1 (2020)
Exports made by the Philippines in the first quarter of the year 2020 amounted to USD 15.73 billion. Amongst all the major exports, the top 10 exported items from the Philippines to the world were as follows:
- Electrical machines and gadgets (USD 7.47 billion)
- Mechanical appliances like boilers and reactors (USD 2.30 billion)
- Edible fruits and nuts (USD 663.07 million)
- Copper products (USD 548.45 million)
- Optical and precision tools (USD 510.17 million)
- Natural and precious stones (USD 484.12 million)
- Ores and slag (USD 320.14 million)
- Edible animal fats and oils (USD 243.46 million)
- Light automobiles (USD 243.25 million)
- Mineral fuels and oils (USD 228.84 million)
QUARTER 1 (2021)
Quarter 1 of the year 2021 also registered exports from the Philippines which were worth USD 17.64 billion. As per the records of the Philippines Customs Data, the top 10 exports from the nation to the world in Q1 (2021) were as follows:
- Electric machines and appliances (USD 8.94 billion)
- Mechanical equipment and products (USD 2.27 billion)
- Copper articles (USD 633.91 million)
- Optical and precision tools (USD 518.98 million)
- Edible fruits and nuts (USD 421.59 million)
- Automobiles (USD 358.59 million)
- Ores and slug (USD 338.59 million)
- Plastic products (USD 306.21 million)
- Animal and plant oils and fats (USD 298.54 million)
- Natural and precious stones (USD 267.83 million)
----------
BIGGEST 10 EXPORT PARTNERS OF THE PHILIPPINES
The major export partners of the nation are namely, the USA, China, Japan, and Singapore. Most of the Philippian goods are transported to these nations annually. After looking at the detailed Philippines Customs Data report, we have created a list of the top 10 export partners of the nation as per the figures of Q1 for the years 2020 and 2021.
|
TOP 10 EXPORT PARTNERS OF THE PHILIPPINES IN Q1 (2020) AND Q1 (2021) |
|||
|
QUARTER 1 (2020) – USD 15.73 Bn. |
QUARTER 1 (2021) – USD 17.64 Bn. |
||
|
Japan |
USD 2.63 billion |
The USA |
USD 2.77 billion |
|
The USA |
USD 2.42 billion |
Japan |
USD 2.68 billion |
|
China |
USD 2.16 billion |
China |
USD 2.54 billion |
|
India |
USD 1.83 billion |
Singapore |
USD 881.46 million |
|
Singapore |
USD 900.95 million |
Thailand |
USD 870.11 million |
|
Thailand |
USD 766.43 million |
Germany |
USD 727.84 million |
|
Korea |
USD 651.91 million |
Korea |
USD 632.19 million |
|
Germany |
USD 631.04 million |
Taiwan |
USD 617.57 million |
|
The Netherlands |
USD 537.74 million |
The Netherlands |
USD 529.98 million |
|
Taiwan |
USD 526.26 million |
Malaysia |
USD 502.38 million |
----------
TOP 10 IMPORT PRODUCTS OF THE PHILIPPINES
Just like exports, the nation imported numerous items from the world in the Q1 of 2020, as well as in 2021. Based on the values registered in the Philippines Trade Data statistics for Q1 of 2022 and Q1 of 2023, the major Imports to the nation from the world were as follows:
QUARTER 1 (2020)
Imports made to the Philippines in the first quarter of the year 2020 amounted to USD 24.68 billion. Amongst all the major imports, the top 10 imported items by the Philippines from the world were as follows:
- Electrical machines and gadgets (USD 6.23 billion)
- Mineral fuels and oils (USD 2.85 billion)
- Mechanical appliances like boilers and reactors (USD 2.6 billion)
- Automobiles (USD 1.95 billion)
- Iron and steel (USD 1.05 billion)
- Plastic products (USD 878.58 million)
- Cereals (USD 632.04 million)
- Optical and precision tools (USD 515.5 million)
- Medical products (USD 441.23 million)
- Aircraft and spaceships (USD 415.51 million)
QUARTER 1 (2021)
Quarter 1 of the year 2021 also registered imports by the Philippines which were worth USD 27.45 billion. As per the records of the Philippines Customs Data, the top 10 imports to the nation from the world in Q1 (2021) were as follows:
- Electric machines and appliances (USD 7.14 billion)
- Mechanical equipment and products (USD 2.78 billion)
- Mineral fuels and oil (USD 2.66 billion)
- Automobile (USD 1.77 billion)
- Iron and steel (USD 1.10 billion)
- Plastic products (USD 1.08 billion)
- Cereals (USD 671.9 million)
- Optical and precision tools (USD 603.08 million)
- Chemical products (USD 470.63 million)
- Packaged medicines (USD 425 million)
----------
TOP 10 IMPORT PARTNERS OF THE PHILIPPINES
Among all the nations of this world, the most favorite import partners of the Philippines are China, followed by Japan, Korea, the USA, and Thailand. Mostly all the imports to the nation are from these nations. According to the Philippines Import Data report, the top 10 imports partners of the nation in Q1 (2020) and Q1 (2021) were:
|
TOP 10 IMPORT PARTNERS OF THE PHILIPPINES IN Q1 (2020) AND Q1 (2021) |
|||
|
QUARTER 1 (2020) – USD 24.68 Bn. |
QUARTER 1 (2021) – USD 27.45 Bn. |
||
|
China |
USD 4.92 billion |
China |
USD 6.61 billion |
|
Japan |
USD 2.42 billion |
Japan |
USD 2.61 billion |
|
Korea |
USD 1.99 billion |
Korea |
USD 2.00 billion |
|
The USA |
USD 1.87 billion |
Indonesia |
USD 1.97 billion |
|
Indonesia |
USD 1.61 billion |
Singapore |
USD 1.81 billion |
|
Thailand |
USD 1.60 billion |
The USA |
USD 1.81 billion |
|
Singapore |
USD 1.53 billion |
Thailand |
USD 1.60 billion |
|
Taiwan |
USD 1.33 billion |
Taiwan |
USD 1.37 billion |
|
Malaysia |
USD 1.15 billion |
Malaysia |
USD 1.28 billion |
|
Vietnam |
USD 815.06 million |
Vietnam |
USD 1.01 billion |
----------
TRADE FORECAST OF THE PHILIPPINES BY QUARTER
The Philippines is currently on the list of the developing and emerging nations of the world. The developmental projects and infrastructural advancements in the nation make our belief stronger that the nation’s economy will improve in the future by several folds.
The ranking of the nation according to the GDP is 36th and this number is forecasted to increase in upcoming years. Being an active member of the ASEAN group of countries and 3rd Major Economy in the group, the nation has numerous opportunities and avenues to grow and build a strong economic base for itself.
----------
BONUS TIP
If you are looking for Accurate and Authentic trade data from the Philippines or any other country in this world, we recommend you connect with TradeImeX today. The trade database and Global Trade reports produced by this company for 70+ nations are directly extracted from ports and guarantee correctness.
To make things easy to understand, we give free samples and demos to our customers so that they can learn the way in which trade reports are studied and interpreted. For more information, contact us today!
WEBSITE: https://www.tradeimex.in
EMAIL ID: info@tradeimex.in
----------
Share
What's Your Reaction?
 Like
0
Like
0
 Dislike
0
Dislike
0
 Love
0
Love
0
 Funny
0
Funny
0
 Angry
0
Angry
0
 Sad
0
Sad
0
 Wow
0
Wow
0