Mongolia import Statistics

Mongolia Import Data

Mongolia, a landlocked nation in East Asia, continues to navigate its economic landscape by leveraging its strategic position between Russia and China. With its rich mineral resources and strategic location between China and Russia, Mongolia offers a wealth of opportunities for importers looking to tap into its market. The country is known for its significant deposits of coal, copper, gold, and other minerals, which are in high demand in markets around the world. As a result, Mongolia has become an attractive destination for foreign investors and importers looking to source these valuable commodities. Mongolia import data offers valuable insights into Mongolia's trade activities, trade relations, and consumer preferences.

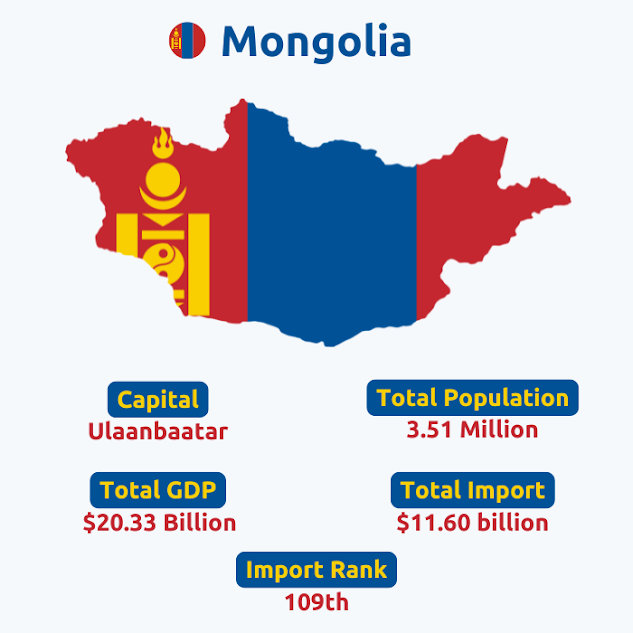
According to Mongolia Import Data and Customs data on Mongolia imports, Mongolia imported goods worth $11.60 billion in 2024, a 25% increase from the previous year. As per Mongolia import statistics, Mongolia is ranked as the 109th biggest importer in the world. The total GDP of Mongolia is $20.33 billion, accounting for a GDP import share of 66.61%. Mongolia is a part of trading blocs such as the WTO and APTA. According to Mongolia Customs Data and data on Mongolia import products, mineral fuels and oils ($2.42 billion) are the biggest and main imports of Mongolia, while China ($4.64 billion) is the largest import partner of Mongolia, as per the data on Mongolia trade partners. Let us explore Mongolia import data for 2024-25, with a key focus on its top imports, key trade partners, and major import trends.

 Mongolia Import Data 2024-25 – Importers & Trade Statistics

109

The country has been ranked 109th in global imports, showing a decent position in the international trade landscape.

0.1%

With a mere 0.1% share in global import trade, it becomes evident that its presence in the international import market is on the rise.

CHINA

China holds a significant role as the largest import partner of the country in terms of goods imports.

MINERAL FUELS AND OILS

Mineral fuels and oils are the country's major and largest import commodities, playing a vital role in its economy.

Please select a country or provide either a description or HS Code.
import

Top 10 Imports of Mongolia: Mongolia Imports by HS Code

Mongolia's top 10 imports, classified by HS Code, provide valuable insights into the country's trade dynamics. Each HS Code represents specific categories of imported goods, shedding light on the products that significantly contribute to Mongolia's economy. Understanding these imports can help businesses make informed decisions regarding market trends and opportunities. Mineral fuels and oils are the major imports of Mongolia, as per the data on Mongolia top imports. The top 10 Mongolian imports, as per Mongolia trade data and Mongolia customs import data for 2024, include:

1. Mineral fuels and oils (HS code 27): 20.86% ($2.42 billion)

2. Vehicles (HS code 87): 19.34% ($2.24 billion)

3. Nuclear reactors and machinery (HS code 84): 13.86% ($1.60 billion)

4. Electrical machinery and equipment (HS code 85): 7.87% ($913.08 billion)

5. Articles of iron or steel (HS code 73): 4.72% ($548.27 billion)

6. Iron and steel (HS code 72): 2.63% ($304.73 billion)

7. Plastics and articles thereof (HS code 39): 1.80% ($209.02 billion)

8. Miscellaneous edible preparations (HS code 21): 1.67% ($193.56 billion)

9. Rubber and articles thereof (HS code 40): 1.62% ($187.75 billion)

10. Pharmaceutical products (HS code 30): 1.62% ($187.61 billion)

Partners

Top 10 Import Partners of Mongolia: Mongolia Imports by Country

Mongolia maintains critical trade relationships with various nations, shaping its import landscape significantly. The major import partners of Mongolia include China, Russia, Japan, and the United States. These countries collectively contribute to Mongolia's diverse import portfolio, influencing its economic development and global connectivity. Mongolia's top 10 import partners as per Mongolia shipment data and Mongolia import data by country for 2024, include:

Value In Percentage(%)

1. China: 40% (4.64 billion US$)

2. Russia: 24.3% (2.82 billion US$)

3. Japan: 10.1% (1.17 billion US$)

4. USA: 4.6% (534.96 million US$)

5. South Korea: 4.2% (481.80 million US$)

6. Germany: 2.2% (254.77 million US$)

7. France: 1.2% (135.68 million US$)

8. Vietnam: 1% (114.93 million US$)

9. Turkey: 1% (112.03 million US$)

10. India: 1% (110.37 million US$)

Sample Data

Understanding Mongolia Customs Data for Imports

We obtain trustworthy data from organizations, shipping businesses, and customs ports. This Trade Data contains a wide range of fields, such as HS codes, product descriptions, prices, quantities, origin country, destination country, and port names together with currency values. For traders and marketers, this trade data is crucial information that helps them to make informed decisions. From the HS codes and product descriptions to the quantity and cost of each product, everything can be obtained through this trade data. We have included a sample of this trade data for your convenience and greater understanding so that you can see what the trade data looks like as a whole, with complete details.

In the global trade arena, understanding Mongolia Customs data for imports is crucial for businesses looking to navigate the market efficiently. By delving into Mongolia import data and shipment data, companies gain valuable insights into the country's import trends, regulations, and potential opportunities. Analyzing and interpreting Mongolia customs data for imports can provide businesses with a competitive edge, enabling them to make informed decisions, optimize supply chains, and ultimately drive success in the region. Mongolia's imports cover various sectors, including manufacturing, machinery, oils, vehicles, and consumer products. Both domestic consumption and economic growth are greatly aided by these imports. According to Mongolia's customs data, the total value of Mongolia's goods imports in 2024 was $11.6 billion. The Mongolia Customs database provides a vast array of information regarding import data. So, as you can see in this sample of Mongolia import data, we obtain trustworthy data from organizations, shipping businesses, and customs ports. The trade data contains many fields, such as HS codes, product descriptions, prices, quantities, origin country, importers/exporters' names and addresses, destination country, port names, and values. For traders and marketers, this trade data and Mongolia shipment data are crucial information that helps them make informed decisions for imports and exports of Mongolia. We have included a sample of the trade data for your convenience and greater understanding so that you can see what the trade data looks like as a whole, with complete details.

Benefits

Benefits of Mongolia Import Data

  • Expand your business into the Mongolia Import Market.
  • Check Mongolia's most recent product demand.
  • Follow the Shipments History of Your Rivals.
  • Give your marketing plan an approach based on import data.
  • Create a powerful brand identity in Mongolia.
  • Create more ROI and future company goals. 
  • Frequently Asked Questions!!

    According to Mongolia Import Data, Mongolia imported goods worth $11.60 billion in 2024-25.

    Mongolia is ranked as the 109th biggest importer in the world, as per Mongolia trade statistics.

    Mongolia’s Imports account for 66.61% of Mongolia's GDP.

    Mineral fuels and oils are the biggest imports of Mongolia, accounting for $2.42 billion in 2024, as per Mongolia trade records.

    Mongolia customs import data can be found exclusively on the TradeImeX website, with customized database reports as per your business needs.

    You might be interested in other continents as well