Lithuania import Statistics

Lithuania Import Data

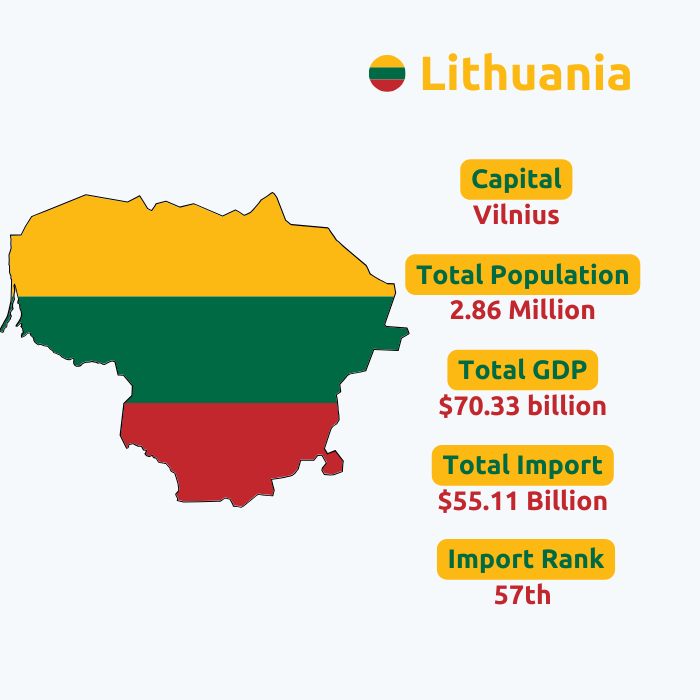
The Republic of Lithuania is another name for Lithuania. The nation is located in Europe's Baltic area. Lithuania borders several nations, including Russia, Belarus, Latvia, and Poland. The economy of Lithuania is categorized as high-income. An important part of Lithuania's economy is agriculture. The nation is ranked 31st in the world according to the complexity index. When it came to GDP, however, the nation ranked 82nd. According to Lithuania trade statistics, Lithuania ranked 60th out of 226 nations in terms of total imports in 2023. In today's globalized economy, countries rely heavily on international trade to meet their domestic demands and foster economic growth. Lithuania, a small but thriving Baltic country in Northern Europe, is no exception. To understand and analyze the country's import trends, Lithuania trade records play a crucial role. 

According to Lithuania’s import data, Lithuania imported goods worth a total of $48.4 billion in 2023. Lithuania had 12% less goods imports in 2023 than in the previous year. Based on Lithuania shipment data, mineral fuels and oils are Lithuania’s biggest imports, while Germany is its biggest import partner. Lithuania’s total GDP is $78.34 billion, with a GDP import share of 89.54%. Lithuania is a part of trading blocs such as the EU, OSCE, NATO, and OECD. Let us now delve into the significance of Lithuania import data for 2023 and explore the key insights into Lithuania statistical data.

 Lithuania Import Data | Lithuania Statistical Data

60

The country has been ranked 60th in global imports, showing a significant position in the international trade landscape.

0.2%

With a mere 0.2% share in global import trade, it becomes evident that its presence in the international import market is fairly on the rise. 

GERMANY

Germany holds a significant role as the largest import partner of the country in terms of goods imports.

MINERAL FUELS AND OILS

Mineral fuels and oils are the major and biggest import commodities of the country, playing a vital role in its economy.

Search live Lithuania Customs import data

Please select a country or provide either a description or HS Code.
import

Top 10 imports of Lithuania: Lithuania Import Data by HS Code

Lithuania, a European country nestled between Latvia, Belarus, Poland, and Russia, has an active and diverse import industry. When it comes to the top 10 imports of Lithuania, the country showcases a range of goods that fuel its economy. Lithuania’s top 10 imports in 2023 according to Lithuania import data and Lithuania shipment data are:

  • Mineral fuels and oils (HS code 27): 19.84% ($9.60 billion)
  • Vehicles (HS code 87): 11.74% ($5.68 billion)
  • Electrical machinery and equipment (HS code 85): 8.64% ($4.18 billion)
  • Nuclear reactors and machinery (HS code 84): 8.56% ($4.14 billion)
  • Plastics and articles thereof (HS code 39): 4.06% ($1.96 billion)
  • Pharmaceutical products (HS code 30): 3.67% ($1.77 billion)
  • Optical, medical, or surgical instruments (HS code 90): 2.18% ($1.05 billion)
  • Articles of iron or steel (HS code 73): 2.1% ($1.01 billion)
  • Iron and steel (HS code 72): 2.01% ($973.21 million)
  • Beverages, spirits, and vinegar (HS code 22): 1.89% ($914.53 million) 
  • Partners

    Top 10 Import Partners of Lithuania: Lithuania Import Data by Country

    As for Lithuania's top 10 import partners, these countries play a crucial role in the nation's import market. The leading import partners of Lithuania contribute significantly to Lithuania's import industry, forming strong trade partnerships and ensuring a steady flow of goods into the country. The top 10 import partners of Lithuania in 2023 based on Lithuania shipment data and Lithuania trade data include:

    Value In Percentage(%)

  • Germany: 13.8% (6.66 billion US$)
  • Poland: 13.2% (6.41 billion US$)
  • Latvia: 8.1% (3.94 billion US$)
  • USA: 6.4% (3.10 billion US$)
  • Netherlands: 5.4% (2.61 billion US$)
  • Norway: 5% (2.44 billion US$)
  • Saudi Arabia: 4.5% (2.17 billion US$)
  • Sweden: 4% (1.94 billion US$)
  • Italy: 3.9% (1.90 billion US$)
  • Estonia: 3.9% (1.87 billion US$)
  • Sample Data

    What is Lithuania Statistical Data for Imports?

    We obtain trustworthy data from organizations, shipping businesses, and customs ports. This Trade Data contains a wide range of fields, such as HS codes, product descriptions, prices, quantities, origin country, destination country, and port names together with currency values. For traders and marketers, this trade data is crucial information that helps them to make informed decisions. From the HS codes and product descriptions to the quantity and cost of each product, everything can be obtained through this trade data. We have included a sample of this trade data for your convenience and greater understanding so that you can see what the trade data looks like as a whole, with complete details.

    Lithuania import data which comes under the statistical database, refers to the detailed information collected and recorded on the imports of goods and services into Lithuania. It encompasses a wide range of data points, including product descriptions, quantities, values, origins, and destinations. This data is collected by various agencies and organizations, such as customs authorities and trade departments, to monitor and assess a country's import activities. According to Lithuania statistical data for imports, Lithuania imported goods worth a total of $48.4 billion in 2023. We offer you highly useful and informative Lithuania import data and shipment information. All of the information in our database is derived from recently updated shipping bills, invoices, and other crucial transaction documents. You will undoubtedly find our database and information to be very helpful in identifying the ideal market for gauging possible gains and market risks. We obtain trustworthy data from approved ports in Lithuania, organizations, and other shipping firms. Lithuanian trade data contains a range of fields. We obtain trustworthy data from organizations, shipping businesses, government authorities, and customs ports. For traders and marketers, this statistical trade data is crucial information that helps them make informed decisions. Everything can be obtained through this shipment data from the HS codes and product descriptions to the quantity and cost of each product. We have included a sample of the trade data for your convenience and greater understanding so that you can see what the trade data looks like as a whole, with complete details. So, as you can see, in this statistical report, we also include the number of goods needed to be imported/exported, HS codes, the product description, quantity, and price of each product from the country's shipment data. In this comprehensive statistical database, we ensure that every detail is meticulously recorded, which makes this trade data efficient for businesses worldwide. 

    Lithuania Import Data
    ID 29599 MONTH Jul-24
    FLOW Import STAT REGIME Normal
    HS CODE 01012100 PRODUCT DESCRIPTION Pure-bred breeding horses
    IMPORTER COUNTRY Lithuania ORIGIN COUNTRY Latvia
    TRADE TYPE Intra-EU Trade SUP QUANTITY 8
    SUPP UNIT NUMBER OF ITEMS NET WEIGHT 4200
    US CIF 8674 VALUE IN EUROS 8000
    Benefits

    Benefits of Lithuania Import Data

  • Obtain business leads from the market in Lithuania.
  • Acknowledge Lithuania's ambition in the market.
  • Access exclusive import trends in Lithuania.
  • Boost your income with a plan driven by import data.
  • Get exclusive insights into the import market in Lithuania.
  • Reach future corporate objectives with superior reports.
  • Frequently Asked Questions!!

    According to the Lithuania trade statistics, Lithuania's total import value for goods in 2023 is $48.4 billion.

    Based on Lithuania trade data and Lithuania trade records, the top imports of Lithuania in 2023 include mineral fuels and oils, electrical machinery and equipment, nuclear reactors, and vehicles. 

    As per Lithuania trade activities for 2023, the main import partners of Lithuania are Germany, Latvia, Poland, the USA, and Norway.

    The import value of Lithuania has declined by 12% compared to the previous year.

    Lithuania's high import volume can be attributed to its strong manufacturing sector, high demand for raw materials, and dependence on energy imports.

    You might be interested in other continents as well