Mongolia export Statistics

Mongolia Export Data

Mongolia, strategically nestled between Russia and China, continues to strengthen its role in international trade by capitalizing on its rich mineral reserves and unique geographical positioning. The country’s export sector is dominated by commodities such as coal, copper, gold, and animal products, which are in high demand globally. As a result, Mongolia has emerged as a vital source of raw materials for key markets, particularly in Asia. Mongolia export data provides crucial insights into the country's export activities, trade partnerships, and commodity flows, helping businesses pinpoint opportunities and forecast market movements.

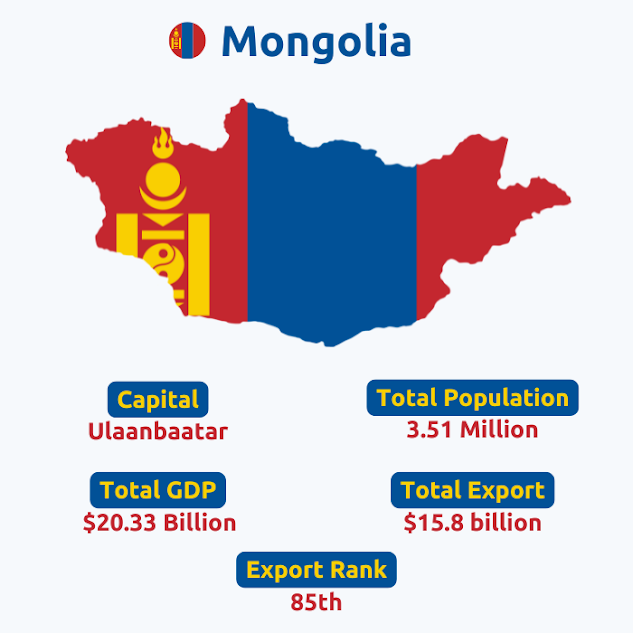
According to Mongolia Export Data and customs statistics, Mongolia exported goods worth $15.8 billion in 2024, marking a notable 4% growth from the previous year. Mongolia is currently ranked as the 85th largest exporter globally. With a total GDP of $20.33 billion, exports make up 51.41% of the country's GDP. As a member of the trading blocs such as the WTO and APTA, Mongolia benefits from preferential trade arrangements. The largest export product of Mongolia by far is coal, as per the data on Mongolia major exports, while China stands as Mongolia’s most dominant export destination. Let's dive into Mongolia’s export trends for 2024–25, focusing on top exported goods, leading trade partners, and emerging patterns.

 Mongolia Export Data 2024-25 – Exporters, Customs & Statistics

85

Mongolia is ranked 85th in global exports, reflecting growing international trade significance.

0.09%

Mongolia contributes 0.09% to total global exports—modest, but expanding steadily.

CHINA

China remains the top destination for Mongolian exports, accounting for a major share of outbound trade.

MINERAL FUELS AND OILS

Mineral fuels and oils are Mongolia’s largest export commodity, driving much of the country's foreign revenue.

Please select a country or provide either a description or HS Code.
export

Top 10 Exports of Mongolia: Mongolia Exports by HS Code

Mongolia’s top exports illustrate the country's dependence on mining and natural resources, as per the data on Mongolia biggest export. Mongolia's top 10 exports, classified by HS codes, are a vital reflection of its economic strengths. Among the leading exports of Mongolia, or the main export of Mongolia, are ores, beverages, and animal products, showcasing the country's rich natural resources and agricultural prowess. These key exports contribute significantly to national income and form the backbone of Mongolia’s global trade. Now the question arises, what does Mongolia export? The top 10 exports of Mongolia, as per Mongolia export statistics and Mongolia export data by HS code, in 2024 include:

1. Mineral fuels and oils (HS Code 27): 57.26% ($9.02 billion)

2. Ores, slag, and ash (HS Code 26): 28.06% ($4.42 billion)

3. Precious stones and metals (HS Code 71): 5.79% ($912.49 million)

4. Wool (HS Code 51): 2.31% ($363.58 million)

5. Salt, sulphur, lime, and cement (HS Code 25): 2.02% ($318.81 million)

6. Meat and edible meat offal (HS Code 02): 1.11% ($174.98 million)

7. Copper and articles thereof (HS Code 74): 0.81% ($127.65 million)

8. Preparations of meat and fish (HS Code 16): 0.59% ($93.56 million)

9. Aircraft, spacecraft, and parts thereof (HS Code 88): 0.33% ($51.27 million)

10. Oil seeds and oleaginous fruits (HS Code 12): 0.29% ($45.23 million)

Partners

Top 10 Export Partners of Mongolia: Mongolia Exports by Country

Mongolia's export economy is tightly linked with regional powerhouses, particularly China. However, other nations are also emerging as strong trade partners. Mongolia's top 10 export partners play a pivotal role in its economy, contributing significantly to its overall trade landscape. As per Mongolia's exports by country data, the key export partners include China, Russia, and the United States, among others. The top 10 Mongolia export partners, as per the data on Mongolia exports by country and Mongolia trade data for 2024, are:

Value In Percentage(%)

1. China: 91.4% (14.40 billion US$)

2. Switzerland: 4.7% (744.97 million US$)

3. USA: 1.1% (166.39 million US$)

4. Russia: 0.5% (82.32 million US$)

5. Iran: 0.5% (80 million US$)

6. Italy: 0.4% (59.63 million US$)

7. South Korea: 0.3% (52.56 million US$)

8. Niger: 0.2% (34.03 million US$)

9. France: 0.1% (20.34 million US$)

10. Hong Kong: 0.1% (14.30 million US$)

Sample Data

Understanding Mongolia Customs Data for Exports

We obtain trustworthy data from organizations, shipping businesses, and customs ports. This Trade Data contains a wide range of fields, such as HS codes, product descriptions, prices, quantities, origin country, destination country, and port names together with currency values. For traders and marketers, this trade data is crucial information that helps them to make informed decisions. From the HS codes and product descriptions to the quantity and cost of each product, everything can be obtained through this trade data. We have included a sample of this trade data for your convenience and greater understanding so that you can see what the trade data looks like as a whole, with complete details.

Navigating Mongolia’s customs export data is essential for businesses aiming to tap into the country’s growing trade network. By analyzing Mongolia export data and shipment records, companies can track market trends, monitor competitor activity, and optimize their strategies. This data includes detailed fields such as HS codes, Mongolia exporters data, quantity, unit price, port of export, and partner countries. Mongolia's export economy is largely driven by mining and agriculture. With global demand for minerals rising, especially from China and regional markets, Mongolia is well-positioned to expand its trade footprint in the coming years. This thorough understanding of Mongolia's customs requirements equips exporters with the knowledge needed to streamline their processes and optimize their supply chains.  So, as you can see in this sample of Mongolia export data and customs data, we obtain trustworthy data from organizations, shipping businesses, and customs ports. The export trade data contains many fields, such as HS codes, product descriptions, prices, quantities, origin country, Mongolia exporters and foreign importers' names and addresses, destination country, port names, and values. For traders and marketers, this Mongolia shipment data is crucial information that helps them make informed decisions. We have included a sample of the trade data for your convenience and greater understanding so that you can see what the trade data looks like as a whole, with complete details.

Sample Not Found

Benefits

Benefits of Mongolia Export Data

  • Discover Mongolia’s top-selling products and rising sectors
  • Monitor competitor shipments and export volumes
  • Shape your export strategy using real-world trade intelligence
  • Identify high-demand international markets
  • Improve ROI by targeting profitable export routes
  • Access historical and latest Mongolia customs export data
  • Frequently Asked Questions!!

    Mongolia exported goods worth $15.8 billion in 2024–25, according to Mongolia export data.

    Mongolia is ranked 85th among global exporters, as per Mongolia export statistics and Mongolia shipment data.

    Mongolia's Exports make up 51.41% of Mongolia’s GDP.

    Mineral fuels and oils, with an export value of $9.2 billion in 2024, are the leading export commodity of Mongolia, or Mongolia main exports, as per Mongolia export data by year and data on Mongolia export products.

    You can find detailed and up-to-date Mongolia export data on the TradeImeX website with fully customizable reports.

    You might be interested in other Countries as well