Historic India-EU Trade Deal Announced: Implications of This Landmark FTA on Global Trade
Historic India–EU trade deal announced. Explore how this landmark free trade agreement reshapes global trade, supply chains, and economic ties.

On January 27, 2026, India and the European Union announced the conclusion of a long-awaited Free Trade Agreement (FTA), marking the end of nearly two decades of negotiations. The agreement immediately stood out, not just for how long it took to finalize, but for its sheer economic scale and geopolitical significance.
This is not a routine trade pact. It connects two of the world’s largest economic blocs, representing nearly 2 billion people, with a combined market of around $27 trillion, around 25% of global GDP, and a combined merchandise trade footprint exceeding USD 6 trillion annually. In a world marked by rising protectionism, tariff wars, and fractured supply chains, the India-EU FTA sends a strong counter-signal: large economies are still willing to commit to deep, rules-based trade integration. According to the latest global trade data and Europe trade data, the total value of India-EU trade reached $136.54 billion in 2025.
This blog breaks down what the India-EU trade deal includes, why it matters, and how it could reshape global trade flows, supply chains, and economic alliances over the next decade.
The Scale of the India-EU Trade Relationship Before the Deal
Indian Prime Minister Narendra Modi and European Commission President Ursula von der Leyen announced the successful conclusion of a landmark India-EU Free Trade Agreement (FTA) in New Delhi in January 2026, capping nearly 20 years of negotiations. The deal was hailed by both leaders as a transformative step in economic partnership, deepening ties between the world’s fastest-growing major economy and one of its most influential trading blocs. Modi called it a “remarkable example of cooperation,” while von der Leyen described it as a win-win that will strengthen trade, investment, and supply chains amid global uncertainty. Even before the India-EU Free Trade Agreement, India and the EU were already significant trade partners.
Pre-FTA Trade Snapshot
-
India–EU bilateral trade (goods + services): USD 135–140 billion annually
-
EU share of India’s total trade: 11–12%
-
India's share of the EU’s total trade: 2.5–3%
-
EU ranked among India’s top three trading partners
-
India ranked among the EU’s top ten external trade partners
However, despite this volume, trade potential remained underutilized due to high tariffs, regulatory barriers, and non-tariff measures, particularly on industrial goods, agriculture, automobiles, pharmaceuticals, and services.
The FTA aims to address exactly these friction points.
What Makes The India-EU Trade Deal “Historic”
Several factors distinguish the India-EU FTA from most modern trade agreements.
1. Economic Weight
-
Covers economies worth USD 20+ trillion combined
-
Involves 27 EU member states and India
-
Impacts trade flows across Asia, Europe, Africa, and the Middle East indirectly
2. Depth of Liberalization
-
Tariff elimination or reduction on over 95% of traded goods by value
-
Coverage goes beyond goods into services, investment, government procurement, intellectual property, and regulatory cooperation
-
Gradual implementation timelines allow sensitive sectors to adjust
3. Timing
-
Comes amid:
-
Slowing global trade growth
-
Fragmentation of supply chains
-
Increasing use of tariffs as geopolitical tools
-
Signals a renewed commitment to multilateralism through bilateral frameworks.
Key Provisions of the India-EU FTA
While final schedules will be phased in over time, the structure of the deal is already clear.
Tariff Liberalization
-
India commits to eliminating or sharply reducing tariffs on:
-
Industrial machinery
-
Chemicals
-
Electrical equipment
-
Medical devices
-
Select automotive components
-
The EU commits to expanded duty-free access for:
-
Indian textiles and apparel
-
Footwear
-
Leather goods
-
Processed foods
-
Engineering goods
Services and Investment
-
Improved market access for:
-
IT and digital services
-
Business process outsourcing
-
Professional services
-
Greater protection for cross-border investments
-
More predictable regulatory frameworks for foreign firms
Regulatory Cooperation
-
Alignment with standards
-
Streamlined customs procedures
-
Reduced technical barriers to trade
This aspect is especially important, as non-tariff barriers often restrict trade more than tariffs themselves.
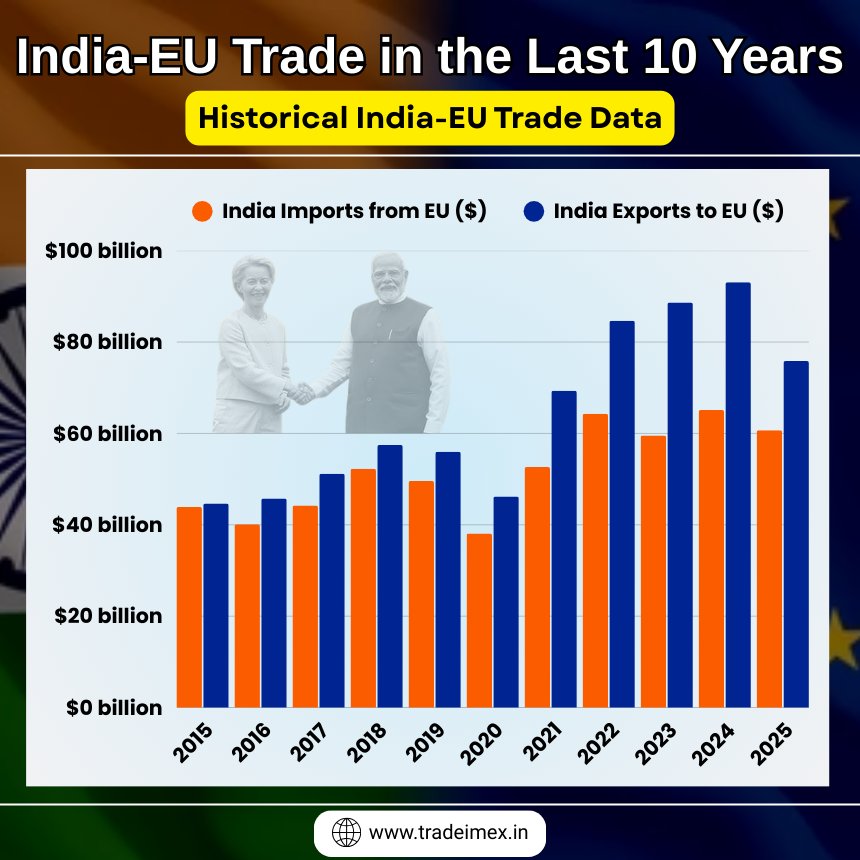
India-EU Trade in the Last 10 Years: Historical India-EU Trade Data
|
Year of Trade |
India Imports from EU ($) |
India Exports to EU ($) |
|
2015 |
$43.91 billion |
$44.69 billion |
|
2016 |
$40.13 billion |
$45.74 billion |
|
2017 |
$44.21 billion |
$51.19 billion |
|
2018 |
$52.29 billion |
$57.47 billion |
|
2019 |
$49.60 billion |
$56 billion |
|
2020 |
$38.10 billion |
$46.20 billion |
|
2021 |
$52.64 billion |
$69.36 billion |
|
2022 |
$64.31 billion |
$84.69 billion |
|
2023 |
$59.56 billion |
$88.66 billion |
|
2024 |
$65.12 billion |
$93.08 billion |
|
2025 |
$60.68 billion |
$75.85 billion |
How the EU Stands to Benefit from the “Mother of All Deals”
India and the European Union announced the conclusion of their long-negotiated Free Trade Agreement, with formal signing expected after legal vetting (around six months), followed by ratification by the European Parliament. For the EU, the deal unlocks one of the world’s fastest-growing major markets while sharply reducing some of the highest tariffs faced by European exporters. Germany is the biggest trade partner of India among the EU member states, as per the data on Germany exports to India.
In 2024, the EU exported over €35 billion worth of goods to India across high-value industrial and technology-driven sectors. Many of these exports were subject to steep tariffs, some exceeding 100%, significantly limiting market penetration. The FTA fundamentally changes that equation.
EU Export Gains from the India-EU FTA (Key Product Categories)
|
Product Category |
2024 EU Exports to India |
Current Tariffs |
Future Tariffs Under FTA |
|
Machinery & Electrical Equipment |
$19.21 billion |
Up to 44% |
0% * |
|
Aircraft & Spacecraft |
$7.14 billion |
Up to 11% |
0% * |
|
Pearls, Precious Stones & Metals |
$4.85 billion |
Up to 22.5% |
0% *** |
|
Optical, Medical & Surgical Equipment |
$3.95 billion |
Up to 27.5% |
0% ** |
|
Plastics |
$2.35 billion |
Up to 16.5% |
0% * |
|
Chemicals |
$2.16 billion |
Up to 22% |
0% * |
|
Iron & Steel |
$2.10 billion |
Up to 22% |
0% * |
|
Motor Vehicles |
$1.88 billion |
110% |
10% (Quota of 250,000 units) |
|
Pharmaceuticals |
$1.07 billion |
11% |
0% * |
Why This Matters for the EU Economy
India Becomes a Scaled Growth Market for EU Industry
India is expected to become the world’s third-largest economy before 2030. Even without tariff barriers, demand for European capital goods, aircraft, medical devices, and chemicals is expanding rapidly due to:
-
Infrastructure investment
-
Industrial modernization
-
Healthcare expansion
-
Urban mobility demand
With tariffs removed, EU exporters gain price competitiveness of 10–40% overnight, depending on the sector.
Machinery and Electrical Equipment: The Biggest Winner
Machinery and electrical equipment already represent the EU’s largest export category to India, at €16 billion in 2024.
-
Tariffs of up to 44% have long constrained demand
-
Zero tariffs will sharply reduce landed costs
-
European firms gain an advantage over non-FTA competitors
This directly benefits:
-
Industrial automation companies
-
Power equipment manufacturers
-
Renewable energy technology suppliers
Aviation and Space: Strategic Market Access
With €6 billion in annual exports, aircraft and spacecraft are one of the EU’s most strategic export segments.
-
Tariff elimination supports aircraft sales, leasing, and maintenance
-
India is among the fastest-growing aviation markets globally
-
The FTA strengthens long-term fleet expansion partnerships
For the EU, this secures industrial jobs, high-value exports, and technological leadership.
Medical Devices & Pharmaceuticals: Healthcare Access Meets Trade Policy
Medical and surgical equipment face tariffs of up to 27.5%, while pharmaceuticals face 11% duties.
Under the FTA:
-
Tariffs drop to zero
-
Regulatory cooperation improves
-
Market access becomes more predictable
These benefits:
-
EU med-tech exporters
-
Drug manufacturers
-
Healthcare technology firms
It also aligns with India’s healthcare expansion goals, making this a mutually reinforcing sector.
5. Automotive Sector: Gradual but Meaningful Access
India’s 110% tariff on fully built vehicles has long been a barrier for European automakers.
The FTA introduces:
-
A reduced 10% tariff
-
A quota of 250,000 vehicles
-
Phased implementation to protect the domestic industry
While not full liberalization, this is a historic opening for EU premium and electric vehicle manufacturers.
6. Chemicals, Plastics, and Metals: Cost Competitiveness Restored
Combined exports across chemicals, plastics, iron, and steel exceed €9 billion annually.
Zero tariffs will:
-
Lower input costs for Indian manufacturing
-
Increase EU supplier competitiveness
-
Encourage long-term supply contracts
These sectors benefit disproportionately because they operate on tight margins, where tariffs often determine sourcing decisions.
India Gains Strategic Access to European Markets
India will receive preferential access to the European Union across 97% of tariff lines, covering 99.5% of the total trade value under the agreement. This access is structured as follows:
-
Immediate zero-duty access will apply to 70.4% of tariff lines, accounting for 90.7% of India’s exports. This mainly benefits labour-intensive sectors such as textiles, leather and footwear, tea, coffee, spices, sports goods, toys, gems and jewellery, and select marine products.
-
Phased zero-duty access over 3 to 5 years will cover 20.3% of tariff lines, representing 2.9% of exports, including certain marine products, processed foods, and arms and ammunition.
-
Preferential access through reduced tariffs or tariff-rate quotas (TRQs) will apply to 6.1% of tariff lines, covering 6% of exports. This includes specific poultry items, preserved vegetables, bakery products, as well as cars, steel, and selected shrimp and prawn products under TRQs.
Key labour-intensive sectors, including textiles and apparel, marine products, leather and footwear, chemicals, plastics and rubber, sports goods, toys, and gems and jewellery, together account for exports worth over ₹2.87 lakh crore (around USD 33 billion). These goods currently face EU import duties ranging from 4% to 26%. With the FTA’s entry into force, they will benefit from zero-duty access, significantly improving their competitiveness in the European market. This is expected to support employment, strengthen export growth, and deepen India’s integration into European and global value chains.
India’s Market Access Offer to the European Union
India, in turn, has offered improved access across 92.1% of its tariff lines, covering 97.5% of EU exports:
-
49.6% of tariff lines will see immediate duty elimination.
-
39.5% of tariff lines will undergo phased tariff elimination over 5, 7, or 10 years.
-
Around 3% of products will be subject to gradual tariff reductions, with tariff-rate quotas (TRQs) applied to select agricultural items such as apples, pears, peaches, and kiwi fruit.
Greater access for EU high-technology goods is expected to diversify India’s import base, lower input costs for domestic industries, benefit consumers, and create new opportunities for Indian companies to plug into global supply chains.
Strategic Implications for the EU
Supply Chain Diversification
The FTA allows EU firms to:
-
Expand sourcing and production partnerships in India
-
Reduce over-dependence on single manufacturing geographies
-
Build resilient Asia-Europe supply chains
Industrial Competitiveness
Tariff-free access improves:
-
Export volumes
-
Profit margins
-
Investment certainty
Geopolitical Signaling
The agreement reinforces:
-
Rules-based trade
-
Economic engagement over protectionism
-
Long-term strategic alignment between India and Europe
Sector-Wise Impact Analysis
Manufacturing and Industrial Goods
For the EU:
-
Gains improved access to India’s fast-growing industrial market
-
Benefits sectors like:
-
Industrial machinery
-
Clean energy equipment
-
Advanced manufacturing tools
For India:
-
Lower input costs for capital goods
-
Technology spillovers
-
Stronger integration into European manufacturing value chains
Expected impact: Increased two-way trade in industrial goods by 40–60% over the next decade.
Automobiles and Auto Components
This was one of the most sensitive negotiation areas.
-
India agreed to phased tariff reductions rather than immediate elimination.
-
EU manufacturers gain gradual access to a high-growth auto market.
-
Indian auto-component exporters benefit from easier EU market entry.
Long-term implication: India strengthens its role as a global auto-component hub, while European firms expand their footprint in India.
Textiles, Apparel, and Footwear
One of the biggest wins for India.
-
EU tariffs on Indian textiles and garments were previously in the 8–12% range.
-
FTA significantly reduces or removes these duties.
-
Indian exporters gain a cost advantage over non-FTA competitors.
Estimated outcome: Indian textile and apparel exports to the EU could grow by USD 8–10 billion annually within five to seven years.
Pharmaceuticals and Healthcare
India already supplies a large share of generic medicines globally.
FTA benefits include:
-
Faster regulatory approvals
-
Reduced compliance duplication
-
Better access to EU healthcare markets
For the EU:
-
Diversified pharmaceutical supply chains
-
Reduced dependency on limited supplier geographies
Strategic importance: Enhances medicine security for Europe while expanding India’s pharma export base.
Agriculture and Processed Foods
This area saw cautious liberalization.
-
Sensitive EU products such as dairy remain protected
-
India gains selective access for:
-
Processed foods
-
Spices
-
Marine products
-
Organic agricultural goods
Impact: Moderate but steady export growth without destabilizing domestic farmers.
Expected Trade Growth from the India-EU FTA
Based on tariff schedules and historical trade elasticity:
-
Bilateral trade could rise from USD 140 billion to USD 200–220 billion by 2030.
-
Average annual growth rate post-implementation: 7–9%.
-
Services trade is expected to grow faster than goods trade.
These projections assume:
-
Full implementation
-
Stable global economic conditions
-
No major trade disruptions
Implications for Global Supply Chains
Supply Chain Diversification
The FTA encourages companies to:
-
Shift sourcing and manufacturing toward India.
-
Use the EU as a gateway to Europe, Africa, and the Middle East.
-
Reduce over-concentration in single-country supply chains.
Near-Shoring and Friend-Shoring
-
European firms see India as a reliable long-term production base.
-
India positions itself as a stable alternative manufacturing partner.
This aligns with broader trends of friend-shoring, where companies prioritize trade with politically aligned partners.
Geopolitical Implications of the Deal
The India-EU FTA is as geopolitical as it is economic.
Reduced Reliance on Single Markets
-
EU diversifies away from excessive dependence on the US and China.
-
India balances its trade exposure across multiple blocs.
Rules-Based Trade vs Tariff Politics
The deal contrasts sharply with:
-
Rising unilateral tariffs
-
Trade disputes driven by political leverage
Instead, it reinforces:
-
Predictability
-
Legal certainty
-
Long-term economic cooperation
Impact of the India-EU FTA on Other Major Economies
United States
-
Faces indirect competitive pressure
-
US firms may see reduced market share in India and the EU
-
Likely to reassess bilateral trade strategies
China
-
Faces stronger competition in manufacturing exports
-
EU firms diversify sourcing away from China
-
India gains strategic leverage as an alternative production base
Developing Economies
-
Countries without FTAs may lose relative competitiveness
-
Pressure increases to negotiate similar trade agreements
Challenges and Risks
Despite its promise, the FTA is not without risks.
Implementation Complexity
-
Regulatory alignment takes time
-
Compliance costs may remain high for small exporters
Domestic Political Sensitivities
-
Farmers and small manufacturers may resist increased competition
-
Adjustment periods will be critical
Uneven Gains
-
Larger firms benefit first
-
SMEs require support to fully leverage the agreement
Long-Term Strategic Outlook
Over the next decade, the India-EU free trade deal is likely to:
-
Reshape trade routes between Asia and Europe.
-
Strengthen India’s role in global manufacturing.
-
Reinforce the EU’s economic engagement beyond its neighborhood.
-
Encourage similar large-scale trade agreements globally.
Most importantly, it demonstrates that large, diverse economies can still find common ground on trade, even in a fractured global environment.
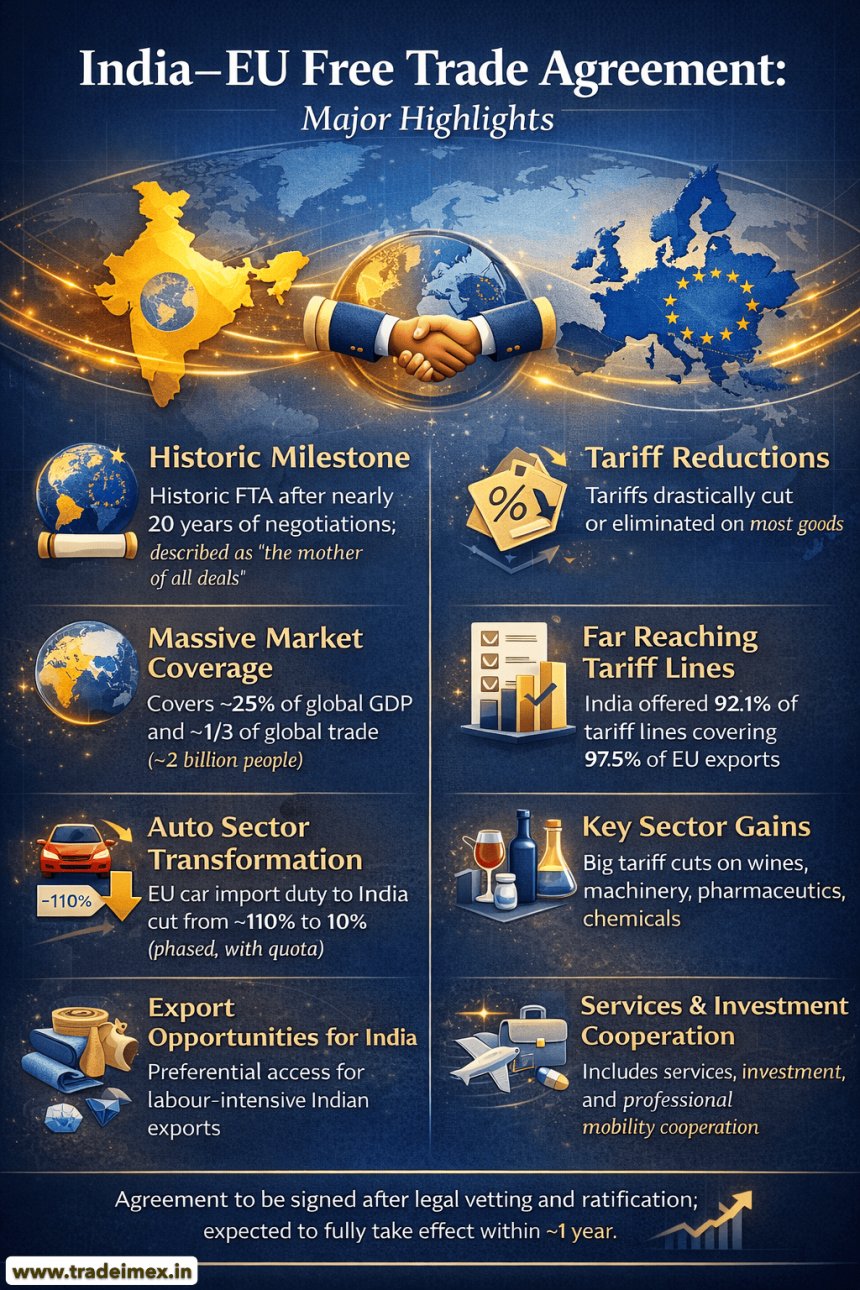
Major Highlights of the India-EU Free Trade Agreement
-
A historic Free Trade Agreement (FTA) was reached between India and the European Union after nearly 20 years of negotiations.
-
Leaders have described the deal as the “mother of all deals” and a major milestone in global trade relations.
-
Covers roughly 25% of global GDP and one-third of global trade, linking a market of around 2 billion people.
-
Tariffs drastically cut or eliminated on most goods: EU exports to India and Indian exports to the EU will see duties reduced on the vast majority of products by value.
-
India has offered 92.1% of its tariff lines, that covers 97.5% of the EU exports.
-
Automobile tariffs slashed, car import duties from the EU to India to fall from around 110% to 10% over a phased period (with quota conditions).
-
Significant tariff cuts on wines, spirits, machinery, pharmaceuticals, and chemicals, boosting trade across key sectors.
-
Indian labour-intensive exports such as textiles, leather, marine products, gems, and jewellery gain preferential access into EU markets.
-
The agreement also includes cooperation in services, investment, mobility of professionals, and strategic partnerships beyond trade.
-
Leaders called the pact a boost to economic growth, supply chain resilience, and strategic cooperation amid global trade tensions.
-
Formal signing and implementation will follow legal vetting and ratification processes, with expectations of it taking full effect within about a year.
Conclusion and Final Verdict
In conclusion, the historic India-EU Free Trade Agreement is more than a trade pact; it is a strategic statement about the future of global commerce. By linking two massive economies through deep market access, regulatory cooperation, and long-term commitments, the deal sets a new benchmark for 21st-century trade agreements. For businesses, it opens new markets and supply chain opportunities. For policymakers, it offers a blueprint for cooperation without coercion. And for the global economy, it reinforces the idea that trade integration, not isolation, remains the most powerful driver of shared growth.
As implementation begins, the real test will lie not in headlines, but in how effectively companies, governments, and institutions turn this landmark agreement into measurable economic gains.
We hope that you liked our data-driven & insightful blog report on the landmark India-EU free trade agreement 2026. For more information on the latest trade data, or to search live import-export data by country, visit TradeImeX. Contact us at info@tradeimex.in for customized trade reports & market insights.
Also read about:
US-Taiwan Trade Relations & Aggreement
Share
What's Your Reaction?
 Like
0
Like
0
 Dislike
0
Dislike
0
 Love
0
Love
0
 Funny
0
Funny
0
 Angry
0
Angry
0
 Sad
0
Sad
0
 Wow
0
Wow
0