Exploring Global Edible Oil Export-Import Data 2025: List of Top Edible Oil Exporters & Importers
Explore global edible oil export-import data for 2025. Discover top edible oil exporters, importers, trade volumes, key markets, and trends.

Introduction
Edible oils sit at the heart of the global food system. From household cooking to packaged foods, hospitality, and industrial use, edible oils are among the most widely traded agricultural commodities globally. In 2024–2025, global edible oil trade continued to expand despite inflationary pressures, geopolitical disruptions, and climate-driven production risks. According to the latest global trade data and global edible oil import data, the total value of edible oil imports reached around $156 billion in 2025, an 8% increase from the previous year. According to the global edible oil export data, edible oil exports accounted for a total value of $159 billion in 2025, a 4% increase from the previous year.
Palm oil, soybean oil, sunflower oil, and rapeseed (canola) oil dominate international trade flows. Together, they account for more than 85 percent of all globally traded edible oils. While production is concentrated in a small number of countries, consumption is widespread, making cross-border trade essential.
This article provides a deep, data-driven analysis of global edible oil exports and imports for 2024–2025, highlighting:
-
Major exporting and importing countries
-
Trade volumes and market shares
-
Oil-wise trade patterns
-
Regional demand trends
-
Policy and structural factors shaping the market
Global Edible Oil Market Overview
In 2024–2025, total global edible oil production is estimated at over 215 million metric tons, while international trade volumes exceed 95 million metric tons, as per the report of the Edible Oil Producers Association. Growth remains steady at around 3–4 percent annually, driven by population growth, rising urbanization, and increased consumption of processed foods.
Key structural features of the market:
-
Palm oil remains the most traded edible oil globally, accounting for roughly 36–38 percent of global edible oil trade.
-
Soybean oil follows closely, supported by large soybean crushing industries in the Americas.
-
Sunflower oil has gained market share due to consumer preference for lighter oils and recent trade realignments.
-
Rapeseed oil remains important in Europe and North America but plays a smaller role in global trade.
The edible oil market is also deeply linked to biofuel policies, especially in Southeast Asia, the United States, Brazil, and the European Union.
Global Edible Oil Market Size and Trade Volume (2025)
Global Production Overview
Total global edible oil production in 2024–2025 is estimated at approximately:
-
215–220 million metric tons
Breakdown by major oil type:
-
Palm oil: 80 million tons
-
Soybean oil: 63 million tons
-
Rapeseed oil: 28 million tons
-
Sunflower oil: 21 million tons
-
Other oils (groundnut, coconut, cottonseed, etc.): 25 million tons
Global Trade Volume
Not all edible oil produced enters global trade. Around 44–46 percent of total production is traded internationally.
-
Global edible oil trade volume: 95–100 million metric tonnes
-
Total trade value: Around USD 200–230 billion, depending on price cycles
Palm oil alone accounts for over one-third of all traded edible oil by volume, making it the single most influential oil in price discovery.
Edible Oil Imports by Country: Top Edible Oil Importing Countries

Edible oil imports play a crucial role in meeting the global demand for cooking oils and essential fats. When looking at the top edible oil-importing countries, significant players emerge on the world stage. Countries like China, India, and the United States stand out as major importers due to their large populations and diverse culinary preferences. These nations rely on importing edible oils to supplement their domestic production and satisfy consumer needs efficiently. The top 10 edible oil-importing countries, as per the data on edible oil imports by country and edible oil shipment data for 2025, include:
1. India: $21.8 billion (18.9%)
India tops the list of the top edible oil-importing countries in the world, with an import value of $21.8 billion, accounting for 18.9% of the total global edible oil imports. The country’s large population and rapid economic growth have driven the demand for edible oils, leading to significant imports from various countries.
2. China: $14.6 billion (12.7%)
China follows closely behind India as one of the top edible oil-importing countries, with an import value of $14.6 billion, representing 12.7% of the total global imports. The country’s growing urbanization and changing dietary preferences have fueled the demand for a variety of edible oils, leading to substantial imports.
3. United States: $11.2 billion (9.7%)
The United States ranks third among the top edible oil-importing countries, with an import value of $11.2 billion, accounting for 9.7% of the total global imports, as per the US edible oil import data by HS code. Despite being a major producer of soybean and other edible oils, the country still relies on imports to meet its domestic demand.
4. Netherlands: $8.9 billion (7.7%)
The Netherlands is a significant player in the global edible oil trade, with an import value of $8.9 billion, representing 7.7% of the total global imports, as per the data on Netherlands edible oil imports by HS code. The country’s strategic location and well-developed trade infrastructure make it a key hub for edible oil imports and distribution in Europe.
5. Germany: $6.4 billion (5.5%)
Germany is another top edible oil importer, with an import value of $6.4 billion, accounting for 5.5% of the total global imports. The country’s strong economy and food processing industry drive the demand for edible oils, leading to substantial imports from various countries.
6. Pakistan: $5.3 billion (4.6%)
This country is among the top edible oil-importing countries, with an import value of $5.3 billion, representing 4.6% of the total global imports. The country’s growing population and increasing disposable income have led to a surge in the demand for edible oils, resulting in significant imports.
7. Bangladesh: $4.9 billion (4.2%)
Bangladesh ranks seventh among the top edible oil-importing countries, with an import value of $4.9 billion, accounting for 4.2% of the total global imports. The country’s reliance on imports to meet its domestic edible oil demand makes it a key player in the global edible oil trade.
8. Italy: $4.6 billion (4%)
Italy is a significant importer of edible oils, with an import value of $4.6 billion, representing 4.0% of the total global imports. The country’s rich culinary tradition and vibrant food industry drive the demand for a variety of edible oils, leading to substantial imports.
9. Spain: $4.2 billion (3.6%)
Spain ranks among the top edible importer countries, with an import value of $4.2 billion, accounting for 3.6% of the total global imports. The country’s Mediterranean diet and thriving food sector contribute to the high demand for edible oils, resulting in significant imports.
10. Egypt: $3.8 billion (3.3%)
Egypt rounds off the list of the top edible oil-importing countries, with an import value of $3.8 billion, representing 3.3% of the total global imports. The country’s growing population and expanding food industry drive the demand for edible oils, leading to substantial imports from various countries.
Edible Oil Exports by Country: Top Edible Oil Exporting Countries
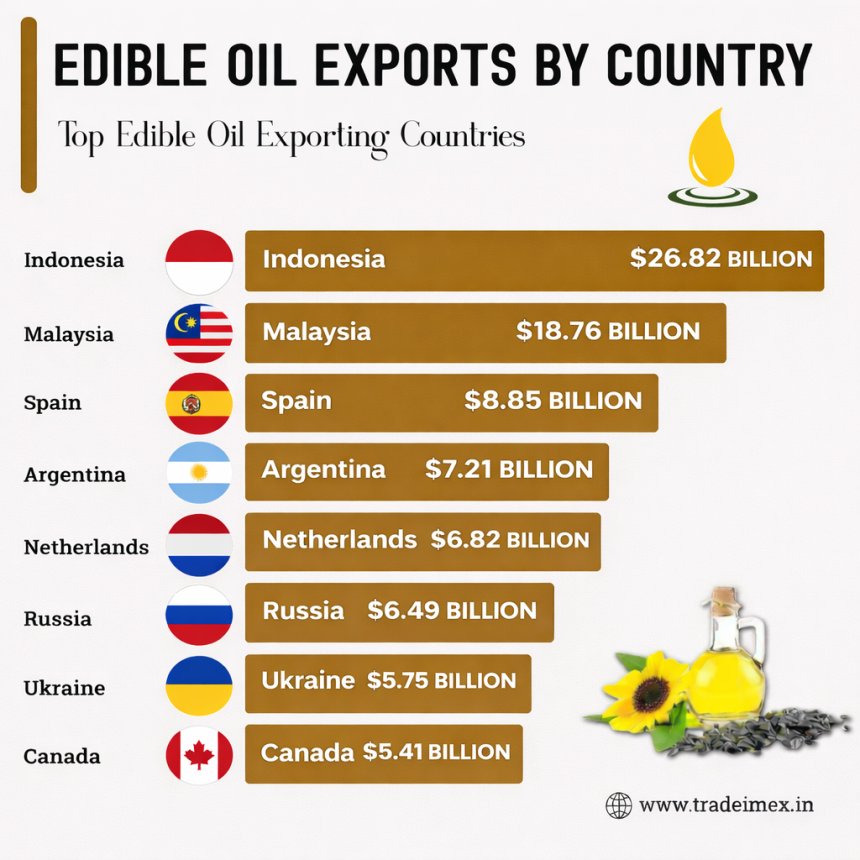
According to the latest data on Edible Oil Exports by Country, several nations stand out as the top Edible Oil exporting countries globally. Among these top exporters are prominent players such as Malaysia, Indonesia, Spain, and Argentina. These countries have established themselves as key contributors to the global Edible Oil market, showcasing impressive export volumes and high-quality products. The top 10 edible oil exporting countries in 2025 include:
1. Indonesia: $26.82 billion (17.9%)
Indonesia holds the top spot as the largest exporter of edible oils, with an impressive export value of $26.82 billion, accounting for 17.9% of the global market share. The country's tropical climate and extensive palm oil plantations make it a key player in the industry, as per the Indonesia customs export data of palm oil.
2. Malaysia: $18.76 billion (12.5%)
Following closely behind Indonesia, Malaysia secures the second position with $18.76 billion in edible oil exports, comprising 12.5% of the market share. The country is renowned for its production of palm oil, which is widely used in various industries worldwide.
3. Spain: $8.85 billion (5.9%)
Spain emerges as a significant player in the edible oil export market, with an export value of $8.85 billion, representing 5.9% of the global market share. The country is known for its olive oil production, which is highly regarded for its quality and health benefits.
4. Argentina: $7.21 billion (4.8%)
Argentina showcases its prominence in the edible oil export sector, generating $7.21 billion in exports, making up 4.8% of the market share, as per the data on Argentina edible oil exports by HS code. The country's production of soybean oil contributes significantly to its export volume.
5. Netherlands: $6.82 billion (4.5%)
The Netherlands stands out as a key player in edible oil exports, with a total export value of $6.82 billion, comprising 4.5% of the global market share. The country serves as a crucial hub for the distribution of edible oils across Europe and beyond.
6. Russia: $6.49 billion (4.3%)
Russia makes its mark in the edible oil export market, with an export value of $6.49 billion, accounting for 4.3% of the global market share. The country's sunflower oil production plays a significant role in its export performance.
7. Ukraine: $5.75 billion (3.8%)
Ukraine demonstrates its significance as an edible oil exporting country, with $5.75 billion in exports, representing 3.8% of the market share. The country's production of sunflower oil and other edible oils contributes to its strong presence in the industry.
8. Canada: $5.41 billion (3.6%)
Canada holds its own in the edible oil export market, with an export value of $5.41 billion, comprising 3.6% of the global market share. The country's canola oil production is a key contributor to its export performance.
9. Italy: $4.72 billion (3.1%)
Italy solidifies its position as a top edible oil exporting country, with $4.72 billion in exports, making up 3.1% of the market share. The country's renowned olive oil production and exports are highly sought after in the international market.
10. China: $4.14 billion (2.8%)
China rounds up the list of top edible oil exporting countries, with an export value of $4.14 billion, accounting for 2.8% of the global market share. The country's production of various edible oils caters to both domestic consumption and international demand.
List of Top Edible Oil Import-Export Companies: Edible Oil Importers & Exporters Database
The Edible Oil Importers & Exporters Database provides a comprehensive and reliable source for businesses seeking to engage in the edible oil market. This database offers detailed insights into leading edible oil importers and exporters, enabling companies to establish valuable partnerships and make informed decisions. The top edible oil importing & exporting companies, as per the edible oil buyers list, edible oil suppliers list, and importer-exporter data for 2025, include:
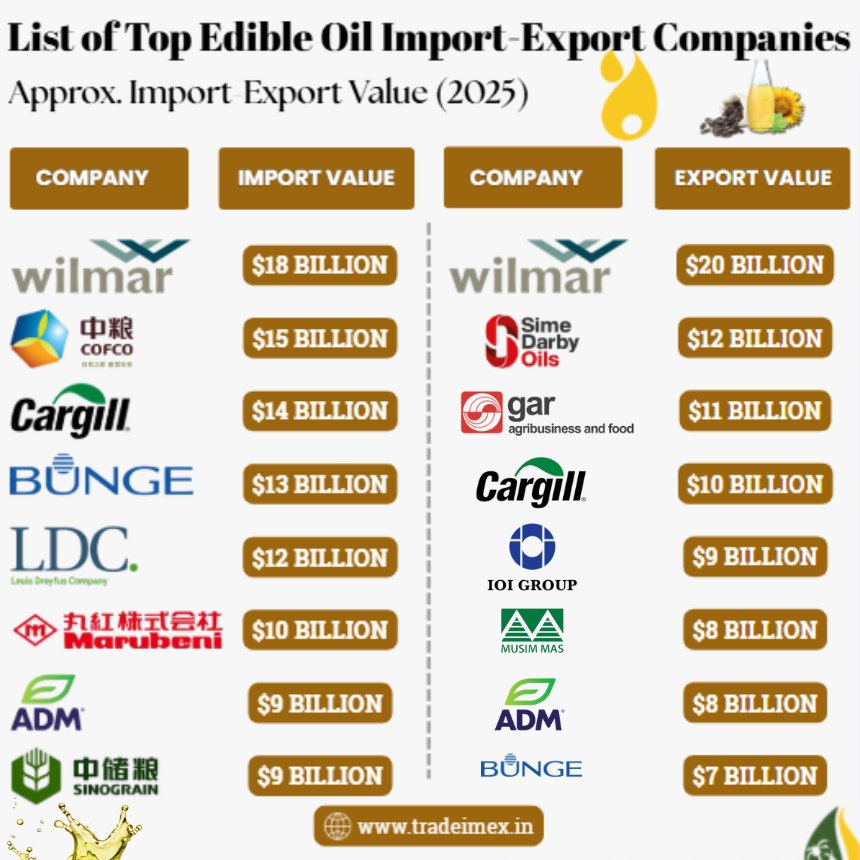
Top Edible Oil Importing Companies
|
Import Company |
Approx. Import Value (2025) |
Top Imported Types |
|
Wilmar International (Singapore) |
$18 billion |
Palm oil, soybean oil |
|
COFCO Group (China) |
$15 billion |
Soybean oil, palm oil |
|
Cargill (USA) |
$14 billion |
Soybean oil, sunflower oil |
|
Bunge (USA) |
$13 billion |
Soybean oil, rapeseed oil |
|
Louis Dreyfus Company (Netherlands) |
$12 billion |
Soybean oil, sunflower oil |
|
Marubeni (Japan) |
$10 billion |
Palm oil, soybean oil |
|
ADM (USA) |
$9 billion |
Soybean oil |
|
Sinograin (China) |
$9 billion |
Soybean oil, palm oil |
|
Itochu (Japan) |
$8 billion |
Palm oil, rapeseed oil |
|
Nestlé (Switzerland) |
$7 billion |
Palm oil, sunflower oil |
Top Edible Oil Exporting Companies
|
Export Company |
Approx. Export Value (2025) |
Top Exported Types |
|
Wilmar International (Singapore) |
$20 billion |
Palm oil, palm fractions |
|
Sime Darby Oils (Malaysia) |
$12 billion |
Palm oil, specialty fats |
|
Golden Agri-Resources (Indonesia) |
$11 billion |
Palm oil |
|
Cargill (USA) |
$10 billion |
Soybean oil, canola oil |
|
IOI Group (Malaysia) |
$9 billion |
Palm oil, oleochemicals |
|
Musim Mas (Indonesia) |
$8 billion |
Palm oil |
|
ADM (USA) |
$8 billion |
Soybean oil |
|
Bunge (USA) |
$7 billion |
Soybean oil |
|
Olam Group (Singapore) |
$6 billion |
Palm oil, sunflower oil |
|
Louis Dreyfus Company (Netherlands) |
$6 billion |
Sunflower oil, soybean oil |
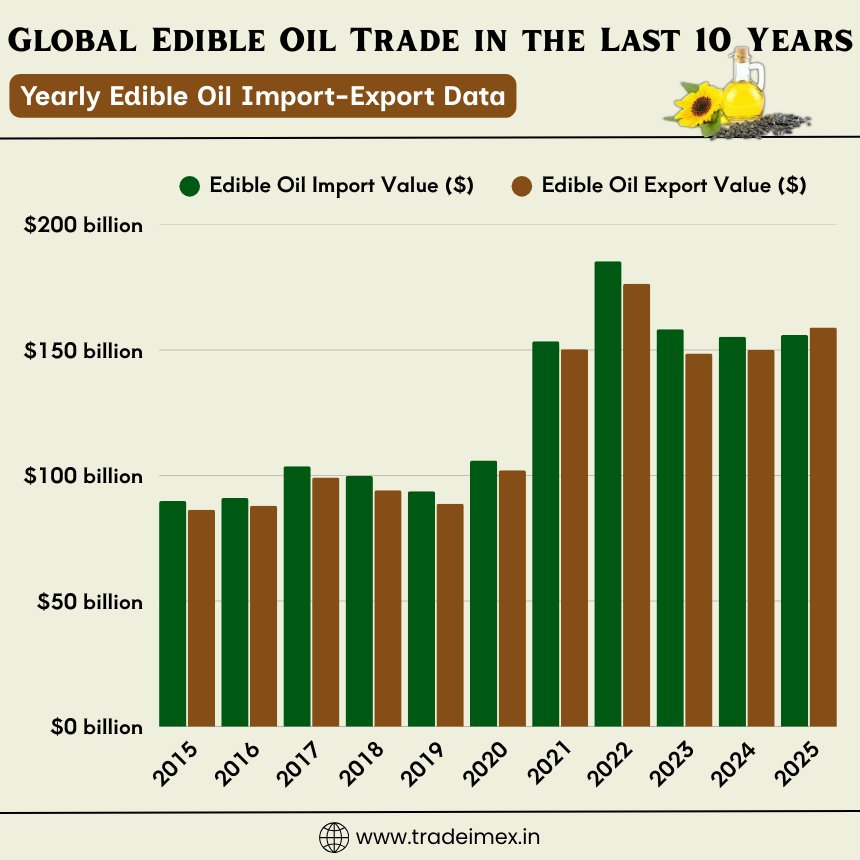
Global Edible Oil Trade in the Last 10 Years: Yearly Edible Oil Import-Export Data
|
Year of Trade |
Edible Oil Import Value ($) |
Edible Oil Export Value ($) |
|
2015 |
$89.83 billion |
$86.32 billion |
|
2016 |
$91.01 billion |
$87.96 billion |
|
2017 |
$103.69 billion |
$99.16 billion |
|
2018 |
$99.83 billion |
$94.08 billion |
|
2019 |
$93.77 billion |
$88.79 billion |
|
2020 |
$105.99 billion |
$102.09 billion |
|
2021 |
$153.45 billion |
$150.34 billion |
|
2022 |
$185.37 billion |
$176.36 billion |
|
2023 |
$158.30 billion |
$148.57 billion |
|
2024 |
$155.31 billion |
$150.07 billion |
|
2025 |
$156 billion |
$159 billion |
Global Edible Oil Market Overview
-
The global edible oil market was valued at approximately USD 245.48 billion in 2024 and is expected to reach USD 253.67 billion in 2025.
-
The market is projected to grow to USD 362.80 billion by 2034, registering a CAGR of around 4.06% during the forecast period.
-
Asia Pacific dominates the global market in terms of consumption, while Europe is anticipated to be the fastest-growing region.
Key Market Drivers
-
Increasing population growth and urbanization are driving higher demand for edible oils worldwide.
-
Rising consumer preference for health-oriented oils such as low-trans-fat, organic, and non-GMO oils is influencing market growth.
-
Advancements in oil extraction and refining technologies are improving product quality and production efficiency.
Market Challenges
-
Volatility in raw material prices such as palm oil, soybean oil, and sunflower oil affects profit margins.
-
Climate change and weather uncertainties pose risks to oilseed crop production and supply stability.
Growth Opportunities
-
Growing demand for premium and specialty edible oils, including avocado, flaxseed, and walnut oils.
-
Expanding consumption in emerging and underdeveloped regions, particularly in Africa, South Asia, and Latin America.
Product & Application Segmentation
-
Key edible oil types include palm oil, soybean oil, sunflower oil, rapeseed oil, and other vegetable oils.
-
Applications span household consumption, food service, and industrial food processing sectors.
Competitive Landscape
-
The market features major global players such as ADM, Bunge, Wilmar International, Cargill, and Associated British Foods.
-
Competitive strategies focus on sustainable sourcing, innovation, capacity expansion, and supply chain optimization.
Oil-Wise Global Trade Dynamics
Palm Oil Trade Dynamics
-
Global trade volume: 50 million tons
-
Export concentration: Indonesia and Malaysia (85%)
-
Price advantage keeps palm oil dominant
Palm oil is often the price anchor for the entire edible oil complex.
Soybean Oil Trade Dynamics
-
Global trade volume: 13–15 million tons
-
Key exporters: Argentina, Brazil, USA
-
Strong linkage with biofuel demand
Sunflower Oil Trade Dynamics
-
Global trade volume: 10–11 million tons
-
Supply concentrated in Black Sea region
-
High price volatility due to limited suppliers
Rapeseed Oil Trade Dynamics
-
Global trade volume: 7–8 million tons
-
Major exporter: Canada
-
Strong demand in Europe
Key Forces Shaping the Market
-
Trade Policy Changes: Import duties, export taxes, and quota systems strongly affect trade flows, especially in India and Argentina.
-
Biofuel Mandates: Biodiesel and renewable diesel policies reduce export availability in producing countries.
-
Climate Variability: Weather patterns impact oilseed yields, influencing supply and price stability.
-
Consumer Preferences: Health awareness drives demand for sunflower and soybean oils in urban markets.
-
Geopolitical Shifts: Changes in Black Sea trade routes have reshaped sunflower oil flows.
Future Outlook: 2026 and Beyond
-
Global edible oil demand expected to grow at 3–4% CAGR
-
Palm oil to remain dominant but face sustainability pressure
-
Sunflower oil demand to grow faster than average
-
The import dependence of India and Africa will deepen
-
Value-added refining trade will expand
Conclusion and Final Thoughts
In conclusion, the global edible oil trade in 2024–2025 remains highly interconnected, competitive, & policy-sensitive. A handful of exporting nations, Indonesia, Malaysia, and Argentina, supply the majority of global demand, while import dependence is concentrated in Asia. India continues to anchor global imports, while China and the European Union shape demand through their scale and regulatory influence. Oil-wise diversification is increasing, with soybean and sunflower oils gaining share alongside palm oil.
Looking ahead, the edible oil market will be shaped by:
-
Sustainability regulations
-
Biofuel expansion
-
Supply chain resilience
-
Shifting consumer preferences
For traders, policymakers, and agri-businesses, understanding these trade dynamics is critical to navigating one of the world’s most essential commodity markets.
We hope that you liked our data-driven & interactive blog on the global edible oil import-export data & market report 2025. To search live edible oil import-export data by country, visit TradeImeX. Contact us at info@tradeimex.in for customized trade reports, market insights, & a verified database of the top edible oil importers & edible oil exporters, as per your requirement.
Share
What's Your Reaction?
 Like
0
Like
0
 Dislike
0
Dislike
0
 Love
0
Love
0
 Funny
0
Funny
0
 Angry
0
Angry
0
 Sad
0
Sad
0
 Wow
1
Wow
1