Brazil Fertilizer Imports Data 2025: Latest Brazil Fertilizer Importers Database & Imports by Country
Explore Brazil fertilizer imports data for 2025 with the latest importers database, supplier countries, shipment details, & insights for global trade analysis.
Brazil remains the world’s largest fertilizer importer by volume in 2025. The country’s agricultural model is input-intensive, export-oriented, and heavily dependent on external nutrient supply. With soybean, corn, sugarcane, and cotton acreage expanding, fertilizer imports have reached new structural highs. In 2025, Brazil saw its fertilizer import volumes hit historic highs. According to the latest Brazil import data and Fertilizer import data of Brazil, the total value of Brazil fertilizer imports reached $15.49 billion in 2025, a 14% increase from the previous year. Brazil is the largest fertilizer importer in the world, according to global trade data.
Brazil imported around 45.5 million tons of fertilizer in 2025, surpassing the previous record of 44.28 million tons registered in 2024. This represents a modest growth year-on-year for fertilizer imports classified under HS code 31 and confirms Brazil’s ongoing structural reliance on global fertilizer supplies. This article provides a detailed, data-driven breakdown of the latest Brazil fertilizer import data for 2025, major import trends, and the Brazilian fertilizer importers database.
Yearly Volume Highlights: Brazil Fertilizer Imports 2025
-
45.5 million tons of total fertilizer imports in 2025, according to official data from the Companhia Nacional de Abastecimento (Conab).
-
8.8% growth in import volume compared to the same period in 2024 (first seven months)
-
Significant monthly records, such as July 2025 with 4.79 million tons, showcased strong seasonal import dynamics.
This growth is closely linked to Brazil’s agricultural cycle, particularly expanded soybean and corn cultivation, where fertilization is essential for yield maximization. The second half of the year typically drives the bulk of imports, especially between May and September.
Why Brazil Imports So Much Fertilizer
Brazil’s domestic fertilizer production covers only a fraction of total demand. Estimates suggest Brazil still produces less than 15% of the fertilizers it consumes, making it heavily dependent on imports for key nutrients such as nitrogen, phosphates, and potash.
This dependency is driven by:
-
Rapid processing & distribution in ports (Paranaguá, Santos, and Northern Arc).
-
High input requirements for modern agronomy, especially in commodity-rich states like Mato Grosso and Paraná.
-
Domestic production bottlenecks and high energy costs for fertilizer manufacture, particularly nitrogenous fertilizers.
Brazil Fertilizer Imports by Country: Where Does Brazil Import Fertilizers From?

Brazil's fertilizer imports by country reveal a diversified global sourcing strategy. When examining where Brazil imports fertilizers from, it becomes evident that the nation relies on various countries for its supply. Key players in Brazil's fertilizer imports include countries like Russia, Canada, the United States, and China. These international partnerships play a crucial role in meeting Brazil's agricultural demands & ensuring a steady supply of fertilizers for the country's vast agricultural sector. The top 10 fertilizer supplier countries to Brazil, as per Brazil fertilizer imports by country and Brazil shipment data for 2025, include:
1. Russia: $4 billion (25.8%)
Russia tops the list as one of the primary sources of fertilizers for Brazil, accounting for a significant 25.8% of Brazil's total fertilizer imports. With a strong fertilizer industry and rich mineral resources, Russia provides Brazil with essential nutrients to support its agricultural sector. Russia is the largest supplier of strong nitrogen & phosphate exports to Brazil.
2. China: $2.90 billion (18.8%)
China, known for its massive fertilizer production capacity, is another key player in supplying fertilizers to Brazil, as per the data on Brazil fertilizer imports from China by HS code. With advanced manufacturing facilities and a wide range of fertilizer products, China remains a critical partner in meeting Brazil's fertilizer requirements.
3. Canada: $1.59 billion (10.3%)
Canada's advanced agricultural industry and expertise in fertilizer production make it a valuable source of fertilizers for Brazil. With a focus on sustainable farming practices and high-quality fertilizers, Canada continues to be a prominent supplier to Brazil's agricultural sector.
4. Morocco: $1.15 billion (7.5%)
Morocco, a leading exporter of phosphates and phosphate-based fertilizers, plays a vital role in meeting Brazil's phosphate fertilizer needs. With its rich phosphate reserves and expertise in fertilizer production, Morocco contributes significantly to Brazil's agricultural productivity.
5. Nigeria: $709.63 million (4.6%)
Nigeria, with its growing fertilizer industry and focus on enhancing agricultural productivity, supplies a considerable amount of fertilizers to Brazil. As a key player in Africa's fertilizer market, Nigeria plays a crucial role in supporting Brazil's agricultural growth.
6. Saudi Arabia: $659.85 million (4.3%)
Saudi Arabia, known for its significant fertilizer production capacity and expertise in the industry, is a trusted partner for Brazil's fertilizer imports. With a focus on quality and innovation, Saudi Arabia provides Brazil with essential nutrients to support its diverse crop production.
7. USA: $616.13 million (4%)
The United States, with its advanced agricultural technology and diverse range of fertilizer products, is a reliable source of fertilizers for Brazil, as per the data on Brazil fertilizer imports from the US. With a focus on sustainable farming practices and high-quality fertilizers, the USA contributes to Brazil's agricultural sustainability.
8. Israel: $499.03 million (3.2%)
Israel, a global leader in agricultural innovation and technology, supplies a significant amount of fertilizers to Brazil. With a focus on precision agriculture and specialized fertilizer products, Israel enhances Brazil's agricultural efficiency and productivity.
9. Oman: $452.94 million (2.9%)
Oman, with its strategic location and expertise in fertilizer production, is an important source of fertilizers for Brazil. With a focus on quality control and innovation, Oman provides Brazil with essential nutrients to support its agricultural development.
10. Egypt: $417.98 million (2.7%)
Egypt, with its rich history in agriculture and expertise in fertilizer production, is a key supplier of fertilizers to Brazil. With a focus on sustainable farming practices and high-quality fertilizers, Egypt makes a significant contribution to Brazil's agricultural sustainability.
This mix reflects a major dependency on Eurasian exporters, particularly Russia and China, which together account for more than 60 percent of fertilizer import volume to Brazil, a pattern that has expanded significantly since 2022–23. In value terms, Brazil’s fertilizer imports in 2025 were valued at US$15.4 billion, making fertilizer procurement a major cost center for the agricultural sector.
Brazil Fertilizer Importers Database: Top Importers & Shipment Records

|
Rank |
Company |
Approx. Import Value 2025 (USD) |
Top Import Types |
Top Import Source |
|
1 |
Yara International (Brazil ops) |
$3 Billion |
Urea, Ammonium Nitrate, NPK blends |
Russia, China |
|
2 |
$2.4 Billion |
Potash (KCl), Nitrogen |
Canada |
|
|
3 |
Mosaic Company |
$2.2 Billion |
Phosphates (MAP/DAP), Potash |
USA, Morocco |
|
4 |
EuroChem |
$1.6 Billion |
Nitrogen, NPK |
Russia |
|
5 |
Fertipar |
$1.2 Billion |
Potash, NPK |
Russia, Belarus |
|
6 |
Heringer |
$1.1 Billion |
NPK blends, Phosphates |
China |
|
7 |
Cibra |
$1 Billion |
Nitrogen, Phosphates |
Morocco, Russia |
|
8 |
AgroGalaxy |
$600 Million |
Potash, NPK |
Canada |
|
9 |
COFCO International (Brazil ops) |
$500 Million |
Nitrogen, Phosphates |
China |
|
10 |
Petrobras |
$400 Million |
Nitrogen inputs, Ammonia |
Qatar, Nigeria |
Breakdown & Context
1. Market Concentration
The top 5 importers account for approximately 55–60% of Brazil’s total fertilizer imports by value.
These firms:
-
Operate blending facilities inside Brazil
-
Import bulk raw nutrients (urea, MAP, potash)
-
Repackage and distribute domestically
Multinational firms dominate high-value imports, while Brazilian distributors focus on regional blending and trade.
2. Dominant Import Categories
Across the top 10 importers:
-
Potash (KCl): largest value segment
-
Urea (HS code 310210): high volume, price sensitive
-
MAP/DAP (HS code 310540/310530): soybean-driven demand
-
NPK Blends (HS code 3105): customized regional demand
3. Supplier Concentration
Primary source countries for Brazil’s largest importers:
-
Russia – Dominant for potash & nitrogen
-
China – Phosphates & nitrogen
-
Canada – Potash
-
Morocco – Phosphates
-
United States – Mixed fertilizers
-
Qatar & Nigeria – Nitrogen/ammonia
Russia and China together represent roughly 60% of the total fertilizer value flowing to these companies in 2025.
Observations for Exporters & Analysts
-
Entry into Brazil typically requires a partnership with one of these top importers.
-
Port infrastructure relationships (Paranaguá, Santos, Northern Arc) are critical.
-
Potash contracts are usually long-term and volume-based.
-
Nitrogen imports are more spot-market sensitive.
-
Brazilian blenders increasingly demand customized NPK ratios based on soil mapping.
Total Market Size 2025
-
Total fertilizer imports: 45–46 million tons
-
Total value: $15-16 billion
-
Top 10 importers combined: $11–13 billion
What a Brazil Fertilizer Importers Database Typically Contains
A professional 2025 importer database would include:
-
Importer company name
-
CNPJ (Brazilian tax ID)
-
Product HS code (e.g., 310210 – Urea)
-
Import volume
-
Country of origin
-
Port of entry
-
Shipment frequency
Such databases are typically used by:
-
Global fertilizer exporters
-
Commodity traders
-
Market research firms
-
Financial analysts
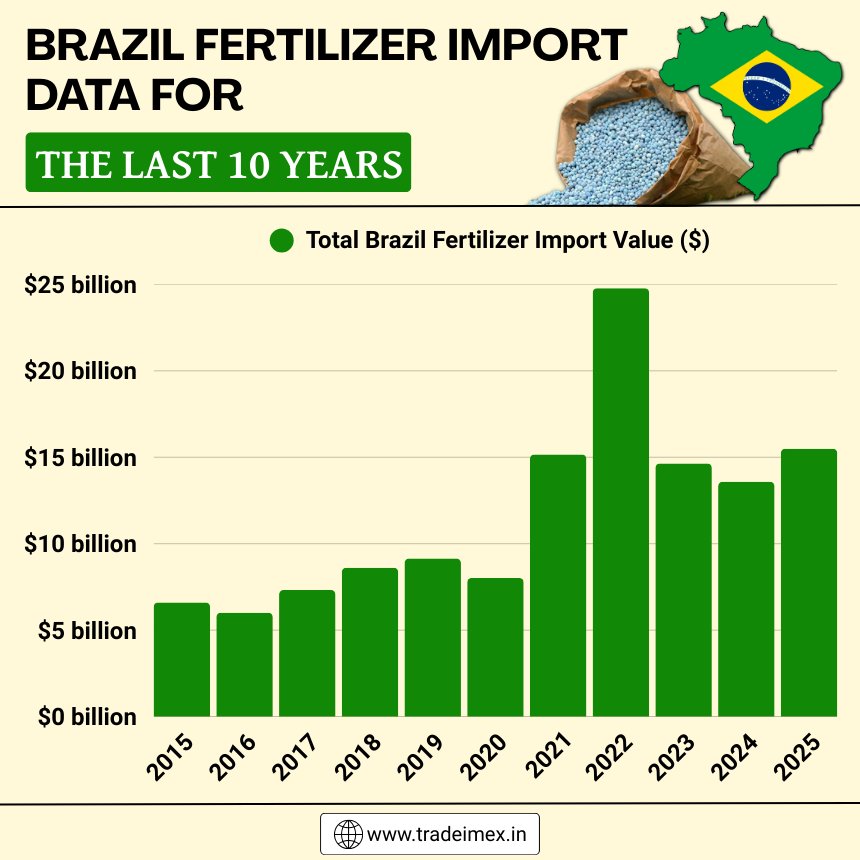
Brazil Fertilizer Import Data for the Last 10 Years
|
Year of Imports |
Total Brazil Fertilizer Import Value ($) |
|
2015 |
$6.60 billion |
|
2016 |
$6.01 billion |
|
2017 |
$7.32 billion |
|
2018 |
$8.61 billion |
|
2019 |
$9.14 billion |
|
2020 |
$8.02 billion |
|
2021 |
$15.16 billion |
|
2022 |
$24.78 billion |
|
2023 |
$14.64 billion |
|
2024 |
$13.58 billion |
|
2025 |
$15.49 billion |
Brazil Fertilizer Imports by Nutrient Type (N, P, K Breakdown)
Brazil’s fertilizer imports are dominated by potash and nitrogen products, with phosphate fertilizers also significant.
Potash (KCl – Potassium Chloride)
-
Accounts for approximately 38–40% of total imports by volume
-
Brazil imports over 95% of its potash needs
-
Estimated 2025 potash imports: 17–18 million tons
Potash is essential for soybean production, which explains its large share.
Nitrogen Fertilizers
Includes:
-
Urea
-
Ammonium nitrate
-
Ammonium sulfate
-
UAN
Nitrogen accounts for roughly 33–35% of imports. The estimated nitrogen fertilizer imports in 2025 are around 15–16 million tons. Brazil shut down several nitrogen plants in the past years due to high gas costs, making imports structurally necessary.
Phosphate Fertilizers
Includes:
-
MAP (Monoammonium Phosphate)
-
DAP (Diammonium Phosphate)
-
TSP
-
NPK blends
Phosphate share: approximately 25–28% of imports. The estimated 2025 phosphate imports are around 11–12 million tons. Brazil has some phosphate reserves, but they are not sufficient to meet demand.
Seasonality & Monthly Import Trends: Brazil Fertilizer Imports 2025
Trade databases indicate that Brazil’s imports of fertilizers in 2025 were valued at around US$15.4 billion, according to the latest United Nations COMTRADE data. This reinforces the continued financial importance of fertilizer inputs in the Brazilian import basket. Brazil’s fertilizer imports follow a predictable cycle:
-
Q1: Moderate imports, price-driven purchases
-
Q2: Acceleration begins
-
Q3: Peak imports (soybean planting preparation)
-
Q4: Stabilization
Import data show that fertilizer volumes fluctuate across the year, with peak import months reflecting the crop planning cycle:
-
January 2025 saw 3 million tons imported, already a record for that month.
-
July 2025 was particularly strong with 4.79 million tons, the largest monthly volume recorded in 2025.
These patterns align with how producers purchase ahead of sowing seasons and respond to geopolitical price shifts over the year. July and August typically show the highest monthly volumes. Breaking this down further:
-
Russia was the top supplier in import value terms, with Brazil receiving approximately $4.36 billion in fertilizer imports from Russian exporters in 2025.
-
China and Canada followed as other major sources in dollar terms.
This cost element directly affects farm economics; higher fertilizer prices increase production costs, influencing commodity pricing and profit margins across Brazil’s global agricultural export markets.
Port Data: Where Fertilizer Enters Brazil
Much of Brazil’s fertilizer imports are handled through a network of key port gateways. These include:
Major Fertilizer Entry Points
|
Port |
Role |
|
Paranaguá (PR) |
The single biggest entry point for imported fertilizers in Brazil is handling around 10.89 million tons in 2025. |
|
Port of Santos (SP) |
Southeast hub with historically strong volumes, though its share decreased slightly in 2025 due to northern trade expansion. |
|
Northern Arc Ports (e.g., Itaqui, Santarém, Barcarena) |
Showed rapid growth, over 8.27 million tons in 2025, highlighting a shift in imports to reduce inland trade costs. |
|
Port of Rio Grande (RS) |
Another key southern port handling fertilizer inflows. |
This decentralization toward northern ports helps Brazil cut transport distance to Midwest agricultural hubs like Mato Grosso, lowering inland shipping costs and reducing supply chain risk.
Domestic Production & Policy Outlook
Brazil’s heavy reliance on imports has driven policy and investment strategies aimed at reducing vulnerability:
-
The National Fertilizer Plan targets reducing import dependence from over 80–85% to around 50% by 2050 via domestic production boosts.
-
Initiatives by state-owned oil company Petrobras aim to restart and expand fertilizer production facilities to supply up to 20–35% of nitrogen fertilizer demand by 2026–2028.
These strategic shifts are driven by global supply volatility and import cost pressures, intensified by geopolitical tensions impacting Russia and other fertilizer producers.
Key Takeaways for Stakeholders
1. Brazil’s Fertilizer Import Volume at a Record High
2025 marked a record year with 45.5 million tons imported, driven by expanded crop acreage and continued domestic reliance on fertilizers.
2. Russia and China Dominate the Supplier Base
Together, they account for the majority of imports, with Russia leading and China rapidly increasing its share.
3. Ports & trade Strategy Is Evolving
Investment in northern port trade suggests a trend toward reducing cost and time inefficiencies in supply chains.
4. Domestic Production Could Rise
Policy reforms & investment in fertilizer manufacturing capacity, particularly nitrogenous fertilizers, could gradually lessen dependence on imports, although this will take years to materialize.
National Fertilizer Plan & Domestic Production Outlook
Brazil’s government aims to reduce import dependency from 85% to 50% by 2050.
Key initiatives:
-
Reactivation of nitrogen plants
-
Potash mining projects in Amazonas
-
Incentives for phosphate exploration
Still, in the short to medium term (2025–2030), Brazil will remain heavily import-dependent.
Market Outlook for 2026
Expected trends:
-
Continued high import volumes (45–48 million tons range)
-
Moderate price stability unless gas markets spike
-
Continued dominance of Russia and China
-
Growth in specialty and controlled-release fertilizers
Conclusion and Final Thoughts
Brazil’s fertilizer import landscape in 2025 reflects an agricultural economy deeply connected to global supply chains. While the country continues to lead as one of the world’s top fertilizer importers, the ongoing diversification of supply sources, expansion of internal trade corridors, and strategic initiatives to foster domestic production signal a gradual but significant evolution in its fertilizer trade dynamics.
Understanding these patterns, from import country shares to trade shifts and domestic policy, is essential for any business, policymaker, or analyst engaged in Brazil’s agribusiness sector.
Note for Our Readers
We hope you found this detailed blog report on Brazil Fertilizer Imports Data 2025 useful and practical. If you’re looking for deeper insights into Brazil fertilizer imports by country, HS code–wise shipment data, or a verified database of Brazilian fertilizer importers and buyers, visit TradeImeX. Access customized Brazil export-import shipment data, company-level trade intelligence, and market entry insights tailored to your business goals.
Turn real trade data into real fertilizer market opportunities with our specialized trade database solutions. For inquiries, partnerships, or sample datasets, feel free to reach out to us at info@tradeimex.in and explore how data-driven decisions can strengthen your position in Brazil’s fertilizer market.
Share
What's Your Reaction?
 Like
0
Like
0
 Dislike
0
Dislike
0
 Love
0
Love
0
 Funny
0
Funny
0
 Angry
0
Angry
0
 Sad
0
Sad
0
 Wow
0
Wow
0