Europe Trade Trends 2025: What's Driving Europe Imports & Exports in Global Trade?
Explore Europe’s trade trends in 2025 with data-backed insights on top European imports, exports, and trade partners with the latest Europe trade data.

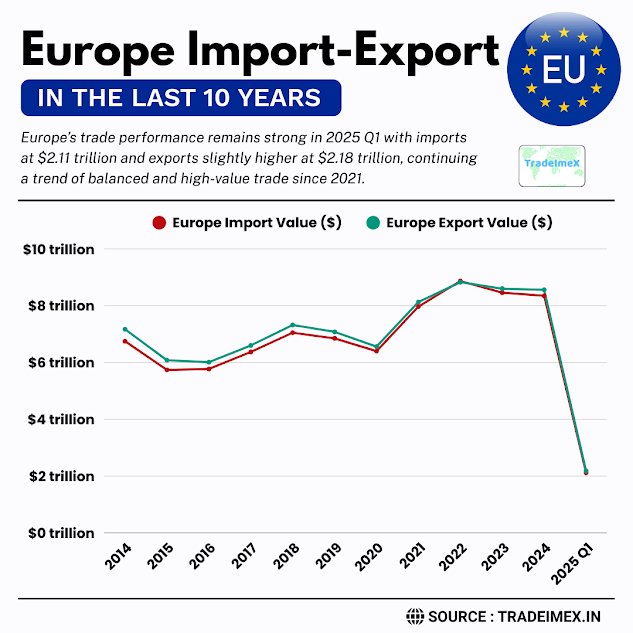
Europe’s trade in 2025 is riding a wave. Strong exports, skyrocketing imports, bold policy shifts, and recalibrated trade are reshaping its global position. According to the Global trade data and Europe trade data, the total value of European imports reached $8.35 trillion in 2024, a decline of 2% from the previous year, while the European exports accounted for a total value of $8.56 trillion in 2024, a 1% decline from the previous year. As per the latest European trade data, Europe exported goods worth $2.18 trillion, while Europe's imports totaled $2.11 trillion in the first quarter of 2025, as per the data on EU trade. Europe makes up 34.7% of the total global imports, while European exports have a total share of 35.8% of the world's exports. In this article, we will delve into the key drivers shaping Europe's trade landscape and explore what the future holds for trade in the region, along with a key focus on the top Europe imports, exports, and trade partners.
Who are the Top Exporting Countries & Importing Countries in Europe
The leading importers and exporters in Europe by country, as per the European trade data for 2024-25, are mentioned below.

Top 10 Importers in Europe: Who are the Biggest European Importer Countries?
The top 10 importers in Europe consist of various countries and industries that dominate the European importing scene. Countries like Germany, France, and the United Kingdom have a significant impact on the European import market. Industries such as automotive, machinery, and electronics play a crucial role in shaping the European import landscape. These top importers are vital in driving the European economy through their extensive import activities, contributing to the region's growth and development. The biggest European importers or the top 10 importers in Europe, as per the European import data for 2024-25, include:
1. Germany: $1.42 trillion (5.9%)
Germany continues to hold the top spot as the largest importer in Europe, with a total value of $1.42 trillion, accounting for 5.9% of total imports in the region, as per the Germany import data. Known for its strong industrial base and high demand for foreign goods, Germany's import market is thriving. Machinery is the most imported commodity of Germany, as per Germany machinery import data.
2. United Kingdom: $815.57 billion (3.4%)
Despite uncertainties surrounding Brexit, the United Kingdom remains a major importer in Europe, with imports totaling $815.57 billion, constituting 3.4% of the region's total imports. With its diverse economy and strong consumer demand, the UK continues to attract goods from around the world, as per the United Kingdom import data.
3. France: $740.81 billion (3.1%)
France holds the third position among the top importers in Europe, with imports valued at $740.81 billion, making up 3.1% of total imports in the region. As one of the largest economies in the European Union, France's import market is essential for global trade.
4. Netherlands: $635.40 billion (2.6%)
The Netherlands is another key player in European imports, with a total import value of $635.40 billion, representing 2.6% of the region's total imports. With its strategic location and well-connected transportation networks, the Netherlands serves as a gateway for goods entering Europe.
5. Italy: $615.59 billion (2.6%)
Italy ranks fifth among the top importers in Europe, with imports amounting to $615.59 billion, accounting for 2.6% of total imports in the region. Known for its strong manufacturing sector and consumer market, Italy's import industry remains robust.
6. Belgium: $519.08 billion (2.2%)
Belgium is also a significant importer in Europe, with a total import value of $519.08 billion, representing 2.2% of the region's total imports. With its open economy and access to major markets, Belgium plays a crucial role in international trade.
7. Spain: $451.30 billion (1.9%)
Spain holds the seventh position among the top importers in Europe, with imports valued at $451.30 billion, making up 1.9% of total imports in the region. With its diverse economy and strong tourism sector, Spain's import market continues to grow.
8. Poland: $379.49 billion (1.6%)
Poland is also a key player in European imports, with a total import value of $379.49 billion, accounting for 1.6% of the region's total imports. With its rapidly growing economy and strategic location, Poland is becoming an increasingly important player in global trade.
9. Switzerland: $369.65 billion (1.5%)
Switzerland ranks ninth among the top importers in Europe, with imports amounting to $369.65 billion, representing 1.5% of total imports in the region. Known for its high standard of living and stable economy, Switzerland's import market remains strong.
10. Czech Republic: $229.39 billion (1%)
The Czech Republic rounds out the top 10 importers in Europe, with a total import value of $229.39 billion, accounting for 1% of total imports in the region. With its growing industrial base and skilled workforce, the Czech Republic is an emerging player in European trade.
Top 10 Exporters in Europe: Who are the Biggest European Exporter Countries?
Europe boasts a diverse range of top exporters, making it a powerhouse in global trade. The biggest European exporters include Germany, leading the pack with its world-renowned automotive, machinery, and chemical industries. Following closely are the Netherlands, known for its agricultural and technological exports, and France, excelling in luxury goods, aerospace, and pharmaceuticals. These countries contribute significantly to Europe's economic growth and global trade influence, making them pivotal players in the international export market. The biggest European exporters or the top 10 exporters in Europe, as per the European export data for 2024-25, include:
1. Germany: $1.68 trillion (7%)
Germany continues to maintain its position as Europe's top exporter, with an impressive export value of $1.68 trillion, as per Germany export data. Known for its high-quality engineering and advanced technology, Germany's products are in demand across the globe. The country's robust manufacturing sector and strong work ethic have contributed to its success in international trade. Vehicles are the top exports of Germany, as per the Germany vehicles export data.
2. Netherlands: $722.29 billion (3%)
The Netherlands ranks second among European exporters, with a total export value of $722.29 billion, as per the Netherlands export data. As a key player in global trade and distribution, the country serves as a gateway to Europe for many international businesses. With a focus on innovation and sustainability, Dutch companies have established a strong presence in global markets.
3. Italy: $674.87 billion (2.8%)
Italy is known for its rich cultural heritage and world-class craftsmanship. With an export value of $674.87 billion, the country ranks third among European exporters. Italian goods, especially in the luxury and fashion industries, are highly sought after worldwide. The country's dedication to quality and design has made it a top player in the global market.
4. France: $626.94 billion (2.6%)
France, with an export value of $626.94 billion, holds the fourth position among European exporters. The country's strong agricultural and aerospace industries, along with its reputation for fine wine and luxury goods, contribute to its export success. French companies are known for their innovation and creativity, attracting customers from around the world.
5. Belgium: $549.57 billion (2.3%)
Belgium's strategic location in the heart of Europe has made it a key player in international trade. With an export value of $549.57 billion, the country ranks fifth among European exporters. Belgian companies excel in industries such as chemicals, pharmaceuticals, and machinery, driving economic growth and competitiveness.
6. United Kingdom: $512.91 billion (2.1%)
Despite recent economic challenges, the United Kingdom remains a major exporter in Europe, with a total export value of $512.91 billion. The country's strong financial services sector, along with industries such as automotive and aerospace, contributes to its export success. British companies continue to innovate and adapt to changing global markets.
7. Switzerland: $446.84 billion (1.9%)
Switzerland is known for its stability, innovation, and high-quality products. With an export value of $446.84 billion, the country ranks seventh among European exporters. Swiss companies excel in sectors such as pharmaceuticals, precision instruments, and luxury watches, attracting discerning customers worldwide.
8. Spain: $403.70 billion (1.7%)
Spain's vibrant culture and diverse economy have helped it become a key player in international trade. With an export value of $403.70 billion, the country ranks eighth among European exporters. Spanish companies in industries such as tourism, agriculture, and renewable energy showcase the country's strengths on the global stage.
9. Russia: $398.11 billion (1.7%)
Russia's vast natural resources and industrial capabilities make it a significant player in global trade. With an export value of $398.11 billion, the country ranks ninth among European exporters, as per Russia customs export data. Russian companies in sectors such as energy, metals, and machinery play a vital role in supplying global markets.
10. Poland: $380.33 billion (1.6%)
Poland has emerged as a dynamic player in European trade, with an export value of $380.33 billion. The country's strategic location, skilled workforce, and competitive business environment have attracted international investors. Polish companies in sectors such as manufacturing, IT, and automotive contribute to the country's export success.
Top 10 Europe Imports by HS Code: What Does Europe Import the Most?
The top 10 Europe Imports by HS Code reveal the key products that Europe imports the most, showcasing the region's trade dynamics. From machinery and electronics to vehicles and pharmaceuticals, these imports play a crucial role in sustaining Europe's industries and meeting consumer demand. The biggest European imports or the top 10 Europe imports in 2024-25, as per the Europe trade data, are:
1. Nuclear reactors and machinery (HS code 84): $928.18 billion
Nuclear reactors and machinery are critical components for various industries, including energy production and manufacturing, as per the machinery import data by HS code. Europe's substantial importation of nuclear reactors and machinery indicates the region's reliance on these technologies for its industrial and energy needs.
2. Electrical machinery and equipment (HS code 85): $895.74 billion
Electrical machinery and equipment play a crucial role in powering Europe's modern economy. From household appliances to industrial machinery, Europe imports a significant amount of electrical equipment to meet its diverse needs.
3. Mineral fuels and oils (HS code 27): $876.28 billion
Mineral fuels and oils are essential commodities for Europe's industries and transportation sector. The region's high importation of mineral fuels and oils reflects its heavy reliance on these resources to power its economy.
4. Vehicles (HS code 87): $825.18 billion
Europe is a major importer of vehicles, including cars, trucks, and other modes of transportation. The importation of vehicles is crucial for meeting the region's transportation needs and supporting its automotive industry.
5. Pharmaceutical products (HS code 30): $494.17 billion
Pharmaceutical products are vital for maintaining public health and well-being. Europe's significant importation of pharmaceutical products highlights the region's commitment to ensuring access to quality healthcare for its citizens.
6. Precious stones and metals (HS code 71): $299.58 billion
Precious stones and metals are highly sought after for their aesthetic value and industrial applications. Europe's importation of precious stones and metals underscores the region's interest in these valuable commodities.
7. Plastics and articles thereof (HS code 39): $295.04 billion
Plastics are ubiquitous in modern society, with a wide range of applications in various industries. Europe's importation of plastics and plastic articles reflects the region's reliance on these materials for packaging, construction, and other purposes.
8. Optical, medical, surgical equipment (HS code 90): $259.25 billion
Optical, medical, and surgical equipment are essential for healthcare providers in Europe. The region's significant importation of these products demonstrates its commitment to maintaining high standards of medical care and technological innovation in the healthcare sector.
9. Organic chemicals (HS code 29): $224.54 billion
Organic chemicals are key components in the production of a wide range of products, from pharmaceuticals to agricultural chemicals. Europe's importation of organic chemicals reflects its diverse industrial base and manufacturing capabilities.
10. Iron and steel (HS code 72): $176.19 billion
Iron and steel are fundamental building blocks of modern infrastructure and manufacturing. Europe's importation of iron and steel indicates the region's ongoing demand for these materials to support construction, automotive, and other industries.
Top 10 Europe Exports by HS Code: What Does Europe Export the Most?
The Top 10 Europe Exports by HS Code provides valuable insight into the goods that Europe exports the most, showcasing the region's economic strengths and trade patterns. European exports span various industries, with machinery, vehicles, pharmaceuticals, and electrical equipment among the top categories exported. These exports play a crucial role in shaping Europe's global trade relationships and contributing significantly to the region's economy. The top 10 exports of Europe, or the leading European exports, as per the European export data for 2024-25, include:
1. Nuclear reactors and machinery (HS code 84): $1.02 trillion
Nuclear reactors and machinery are among the top exports from Europe, with a total value of $1.02 trillion. Europe is home to some of the world's leading nuclear technology companies, making it a key player in this sector. These exports include nuclear reactors, boilers, machinery, and mechanical appliances.
2. Vehicles (HS code 87): $847.78 billion
The automotive industry is a vital part of Europe's economy, with vehicle exports totaling $847.78 billion. European car manufacturers are renowned for their innovation, quality, and design. Vehicles exported from Europe include cars, trucks, buses, and motorcycles.
3. Mineral fuels and oils (HS code 27): $782.75 billion
Europe is a major exporter of mineral fuels and oils, with a total export value of $782.75 billion. The region has significant reserves of oil and natural gas, making it a key player in the energy sector. Europe's exports in this category include petroleum oils, coal, natural gas, and other fuels.
4. Electrical machinery and equipment (HS code 85): $720.89 billion
Electrical machinery and equipment exports from Europe amount to $720.89 billion. Europe is known for its advanced technology and manufacturing capabilities in this sector. These exports include electrical machinery, sound equipment, telecommunication equipment, and more.
5. Pharmaceutical products (HS code 30): $714.28 billion
Europe is a major exporter of pharmaceutical products, with total exports valued at $714.28 billion. The region is home to leading pharmaceutical companies that produce a wide range of medicines, vaccines, and medical supplies, as per the pharmaceutical export data. European pharmaceutical exports are in high demand globally.
6. Precious stones and metals (HS code 71): $338.41 billion
Europe exports precious stones and metals worth $338.41 billion. The region is known for its high-quality diamonds, gold, silver, and other precious metals. These exports play a significant role in the global jewelry and luxury goods markets.
7. Optical, medical, or surgical equipment (HS code 90): $307.82 billion
Europe's exports of optical, medical, or surgical equipment total $307.82 billion. The region is a leader in healthcare technology and innovation, producing a wide range of medical devices, instruments, and equipment. European exports in this category are highly valued for their quality and reliability.
8. Plastics and articles thereof (HS code 39): $289.53 billion
Plastics and articles thereof are major exports from Europe, with a total value of $289.53 billion. Europe is a significant producer of plastic products, including polymers, packaging materials, and plastic goods. These exports are utilized in various industries worldwide.
9. Organic chemicals (HS code 29): $224.66 billion
Europe exports organic chemicals valued at $224.66 billion. The region produces a wide range of chemical products, including pharmaceuticals, fertilizers, and industrial chemicals. European organic chemicals are known for their quality and compliance with international standards.
10. Iron and steel (HS code 72): $176.84 billion
Europe's exports of iron and steel total $176.84 billion. The region has a long history of iron and steel production, with a strong manufacturing base. European iron and steel exports include raw materials, finished products, and components used in various industries.
Europe Import-Export in the Last 10 Years: Historical Europe Trade Data
|
Year of Trade |
Europe Import Value ($) |
Europe Export Value ($) |
|
2014 |
$6.75 trillion |
$7.17 trillion |
|
2015 |
$5.74 trillion |
$6.08 trillion |
|
2016 |
$5.77 trillion |
$6.01 trillion |
|
2017 |
$6.37 trillion |
$6.60 trillion |
|
2018 |
$7.05 trillion |
$7.32 trillion |
|
2019 |
$6.85 trillion |
$7.08 trillion |
|
2020 |
$6.40 trillion |
$6.56 trillion |
|
2021 |
$7.97 trillion |
$8.13 trillion |
|
2022 |
$8.87 trillion |
$8.83 trillion |
|
2023 |
$8.46 trillion |
$8.60 trillion |
|
2024 |
$8.35 trillion |
$8.56 trillion |
|
2025 quarter 1 |
$2.11 trillion |
$2.18 trillion |
Europe’s Trade at a Glance
Major Trade Statistics
|
Metric |
Value (USD) |
YoY Change |
|
Agri-food exports (Q1 2025) |
$64.7 billion |
+3% |
|
Agri-food imports (Q1 2025) |
$52.2 billion |
+20% |
|
Overall EU goods trade surplus (2024) |
$191 billion |
+231% |
|
China–EU rail freight volume (2024) |
330,700 TEU |
+80% |
-
Exports in agri-food climbed 3% to $64.7 billion.
-
Imports spiked 20% to $52.2 billion, with high commodity prices being a major driver.
-
The total trade surplus reached $191 billion, significantly higher than in 2023.
-
Rail freight volumes surged nearly 80%, signaling strong trade diversification.
Why it matters: These basic numbers show Europe is exporting more, importing more, and profiting more, tapping opportunities and absorbing risks.
Europe Export Breakdown: What’s Fueling the Rise?
Agri-Food Goods
-
Cocoa, coffee, dairy, and confections are shining.
-
Cocoa alone doubled in price year-over-year, lifting chocolate and cocoa product exports 21%, adding $100–150 million in growth.
-
Dairy exports increased 7%, contributing an extra $23M.
-
Cereal exports (wheat, maize) fell—volumes dropped 27%, costing exporters close to $1.09B.
Key insight: Commodity price swings are powering the agri-food boom. The EU wins from exporting its value-added processed foods, while raw grains face volume headwinds.
Capital Goods, Machinery & Vehicles
-
Demand from Asia and North America remains solid—Europe’s reputation for engineering excellence holds.
-
Machinery exports, especially industrial automation and agricultural equipment, stayed steady.
-
Automobiles face tariff uncertainty, but export volumes to non-U.S. regions (Latin America, Africa) are up 4–6%.
Note: European automakers are hedging risks via new trade routes and accelerating their electric vehicle (EV) strategy to sidestep U.S. tariffs.
Chemicals & Pharmaceuticals
-
Robust medical and specialty chemical exports—particularly reagents, plastic precursors, and vaccines- rose 4–5%.
-
Pharma exports are a strong pillar, maintaining a $40–45 billion pace.
-
The strategic pivot toward health and green chemicals supports long-term growth.
Digital & Tech Services
-
Though not in goods trade stats, services remain essential: finance, software, and design services are bundled with exported products.
-
Strong intellectual property flows and cloud/AI service exports are reinforcing the EU’s premium goods advantage.
Rising Europe Imports: What’s Driving the Surge?
Agri-Commodities: Cocoa, Coffee, Oils
-
Cocoa imports from Côte d’Ivoire surged 84%.
-
Coffee imports from Brazil to Europe grew by 50% due to demand and inventory restocking.
-
Fruits, nuts, and edible oils climbed 15–20%, largely from Latin America and Asia.
Outcome: Europe is importing more raw and semi-raw food for processing, feeding its export chain.
Energy & Raw Material Inputs
-
Oil and gas imports stabilized post-2024 price fluctuations—import costs are slightly up, but manageable.
-
Iron, steel, and aluminum imports softened due to CBAM but continue as capacity is upgraded.
-
Construction materials: cement, lumber, and specialty metals rose 5–8%, amid rebuilding efforts.
Intermediate and Consumer Goods
-
Intermediate goods (chemicals, plastics, corrosion-resistant metals) grew 1.4% in value, about $240 billion.
-
Consumer electronics, toys, and apparel saw +7.9% imports around $265 billion, driven by consumer demand and retail restocking.
Geographical Shift in Sources
-
Nearshoring trend: China’s share dipped; India, Vietnam, Turkey, Brazil, Morocco gained ground.
-
This diversification added 5–7% to import costs short term, a strategic investment in resilience.
-
African sourcing grew into pharmaceuticals, textiles, and chemicals.
Key Drivers Behind These Shifts
Major Trade Agreements
-
EU–Mercosur Agreement final text agreed, pending ratification. Cuts 93% of tariffs—a significant boost for cars, machinery, wine, and dairy.
-
CPTPP accession remains under negotiation. If Europe joins, it taps into a combined GDP of over $13T and gains better access to Japan, Canada, and Australia.
-
EFTA deals with India, Malaysia, and Morocco, all boosting exports via lower tariffs and regulatory alignment.
Geopolitical Pressures & Tariffs
-
U.S. adding tariffs on copper, semiconductors, and autos—scheduled for August 1, 2025. This threatens $2.5–3.8B in European auto exports.
-
Ongoing EU–US trade talks aim for “mini-deals” on cars, steel, and digital trade could avert worst-case scenarios.
-
CBAM makes carbon-heavy imports more expensive—steel, cement, fertilizers face additional compliance fees ($1.2–1.8B burden for exporters).
Deep Dive: Sector-by-Sector Analysis
Agri-Food Sector
Exports:
-
Cocoa products: +21%, dairy +7%.
-
Still vulnerable to price swings and climate risks, but rising branding and premiumization (organic, fair-trade) help margins.
Imports:
-
Cocoa & coffee dominate—driven by export processing demands.
-
Meat and grains stabilized post-Ukraine war grain imports.
-
Fruits, nuts, and oils from developing economies are filling the growing demand.
Challenges: Climate change, supply shocks, biodiversity regulation, CBAM compliance on palm oil, soy, and beef.
Manufacturing & Machinery
-
European machinery exporters hold strong—automation systems, automotive parts, robotics in demand.
-
Autos - pivoting to EV, value-added components (batteries, chips).
-
Intermediate goods: chemicals, plastics, and specialized metals remain in flux due to U.S. supply changes.
Long game: Maintain technological edge, invest in battery production, resilience in electronics supply—amid increasing protectionism.
Raw Materials & Energy
-
Raw steel and aluminum imports are subject to CBAM’s embedded emissions fees, and companies investing in cleaner production to stay competitive.
-
LNG imports are prevalent as a short-term energy hedge.
-
Renewables and electrolyzed equipment (for hydrogen) are expected to surge, driving the next import phase.
Technology & Digital Trade
-
Services exports (design, finance, software) underpin goods trade, often invisible in goods data.
-
Smart tech components (sensors, AI modules, electric motors) feed European manufacturing.
-
Cloud and SaaS exports to the U.S., Asia, and Africa are rising—Europe is locking in intellectual property revenues.
Strengths, Weaknesses, Opportunities, Threats
Strengths
-
Diversified export base: food, auto, pharma, machinery.
-
Green premium/certifications: EU goods are considered sustainable & reliable.
-
Strategic trade pacts: Mercosur, CPTPP, EFTA expansion.
Weaknesses
-
Tariff risks: U.S. protectionism on autos, semiconductors, metals.
-
Rising trade costs—plus uncertainty from reroutes.
-
Carbon pricing & compliance pressures, CBAM, ESG standards, complicating sourcing, pricing.
Opportunities
-
Nearshoring ties & new digital corridors (IMEC, Global Gateway).
-
Green infrastructure investments are unlocking African, Latin American, and Asia-Pacific trade.
-
Tech and IP leadership—AI, biotech, specialized materials.
Threats
-
Geopolitical shocks: new Red Sea disruptions, China–U.S. tensions, Ukraine war.
-
Climate impacts: drought, floods, and a reduction in Europe’s agricultural export potential.
-
Economic slowdown: if the U.S./China slow down, demand for European goods drops.
Strategic Recommendations for Europe
-
Conclude EU–U.S. mini-deals by Q3–Q4 2025 to neutralize tariff risks on autos and metals.
-
Accelerate CPTPP accession—expected benefit: $50B–75B yearly in additional trade.
-
Scale CBAM compliance support for SMEs and trading partners in Africa/Asia.
-
Expand digital trade—AI, blockchain—to cut up to 10% in transit times across future disruptions.
-
Bolster green corridor investments (ports, rail, renewables) in Africa/Middle East via Global Gateway.
-
Support diversification of sourcing via training, digital platforms, and multi-country procurement hubs.
-
Invest in battery, clean chemical, and biomanufacturing capacity regionally to reduce reliance on imports and boost exports.
Outlook: Late 2025 Into 2026
-
Mini-deals or no deals with the U.S. will define exports across metals, autos, and semiconductors.
-
Mercosur: Tariff cuts to kick in gradually—automotive and food sectors to benefit mid-2026.
-
CBAM: Biggest adjustments still to come in 2026–2027 as third countries build cleaner supply chains.
-
Green infrastructure continues building: 70% of Global Gateway funds likely to be committed by the end of 2026.
What is Driving the European Trade Data?
-
Cross-Border Trade Agreements
-
Technological Advancements
-
Sustainable Practices
-
Political Developments
Final Takeaway
Europe’s trade engine is firing on multiple cylinders:
-
It’s exporting more and richer products.
-
It’s paying more to get raw materials.
-
Investments in policy, trade, and green standards are paying off.
But the horizon isn’t without clouds: U.S. tariffs, red sea disruptions, carbon rules, climate risks. The coming months will test whether Europe can turn strategic planning into trade resilience. If it does, it may not only survive 2025’s volatility, but it could emerge as the powerhouse of clean, smart global trade.
Conclusion and Final Verdict
In conclusion, Europe's trade trends in 2025 are being shaped by a combination of factors, including cross-border trade agreements, technological advancements, sustainable practices, and political developments. By understanding these key drivers, businesses can adapt to the changing trade landscape and capitalize on new growth opportunities. As we look ahead to the future, it is clear that Europe will continue to play a crucial role in global trade, driving innovation, sustainability, and economic cooperation.
We hope that you liked our insightful & data-driven blog report on Europe Trade Trends 2025. For more such countries or continent-specific trade data and to search live import-export data by country, visit TradeImeX. Contact us at info@tradeimex.in to get a customized database report on Europe trade data.
Share
What's Your Reaction?
 Like
0
Like
0
 Dislike
0
Dislike
0
 Love
0
Love
0
 Funny
0
Funny
0
 Angry
0
Angry
0
 Sad
0
Sad
0
 Wow
0
Wow
0